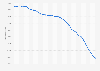
The number of paid community newspapers in Quebec stood at 160.85 thousand in 2022, down from the previous year. Meanwhile in Nunavut Territory, the number of paid community newspapers increased, amounting to almost 2.5 thousand in 2022.
Circulation of paid community newspapers in Canada from 2013 to 2022, by province and territory
(in 1,000s)
Characteristic
2013
2015
2016
2020
2021
2022
Ontario
336.21
283.06
265.86
219.88
164.47
160.86
Quebec
161.31
96.34
96.14
73.81
72.18
68.2
Alberta
141.09
115.21
91.08
69.3
77.97
61.32
British Columbia
72.68
55.56
53.54
56.94
52.6
40.25
Saskatchewan
86.38
71.42
64.73
42.85
39.51
34.32
Manitoba
55.69
46.44
44.95
33.35
29.15
29.02
New Brunswick
42.63
37.99
35.01
30.57
28.47
27.3
Nova Scotia
56.81
49.5
44.07
32.7
26.97
24.94
Northwest Territory
21.63
19.32
18.12
9.26
8.04
7.94
Yukon Territory
6.53
5.27
4.87
3.51
3.51
6.58
Prince Edward Island
7.5
5.79
5.65
5.37
5.08
4.91
Newfoundland/Labrador
34.68
26.14
21.77
7.15
2.19
3.34
Nunavut Territory
4.46
3.98
4.42
2.11
2.31
2.46
0100200300255075125150175225250275325350375
Add this content to your personal favorites. These can be accessed from the favorites menu in the main navigation.
You have no right to use this feature.
Make sure to contact us if you are interested in scientific citation.
You can upgrade your account to enable this functionality for all statistics.
This feature is not available with your current account.Request access
Learn more about how Statista can support your business.
News Media Canada. (February 2, 2023). Circulation of paid community newspapers in Canada from 2013 to 2022, by province and territory (in 1,000s) [Graph]. In Statista. Retrieved February 19, 2025, from https://www.statista.com/statistics/445773/circulation-paid-community-newspaper-canada-province/
News Media Canada. "Circulation of paid community newspapers in Canada from 2013 to 2022, by province and territory (in 1,000s)." Chart. February 2, 2023. Statista. Accessed February 19, 2025. https://www.statista.com/statistics/445773/circulation-paid-community-newspaper-canada-province/
News Media Canada. (2023). Circulation of paid community newspapers in Canada from 2013 to 2022, by province and territory (in 1,000s). Statista. Statista Inc.. Accessed: February 19, 2025. https://www.statista.com/statistics/445773/circulation-paid-community-newspaper-canada-province/
News Media Canada. "Circulation of Paid Community Newspapers in Canada from 2013 to 2022, by Province and Territory (in 1,000s)." Statista, Statista Inc., 2 Feb 2023, https://www.statista.com/statistics/445773/circulation-paid-community-newspaper-canada-province/
News Media Canada, Circulation of paid community newspapers in Canada from 2013 to 2022, by province and territory (in 1,000s) Statista, https://www.statista.com/statistics/445773/circulation-paid-community-newspaper-canada-province/ (last visited February 19, 2025)
Circulation of paid community newspapers in Canada from 2013 to 2022, by province and territory (in 1,000s) [Graph], News Media Canada, February 2, 2023. [Online]. Available: https://www.statista.com/statistics/445773/circulation-paid-community-newspaper-canada-province/
Profit from additional features with an Employee Account
Please create an employee account to be able to mark statistics as favorites.
Then you can access your favorite statistics via the star in the header.
Profit from the additional features of your individual account
Currently, you are using a shared account. To use individual functions (e.g., mark statistics as favourites, set
statistic alerts) please log in with your personal account.
If you are an admin, please authenticate by logging in again.