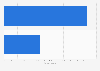
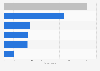
This statistic presents the housing affordability index among Millennials in the United States as of June 2015, by city. The index presents how much money the Millennials need to earn per year in order to be able to buy a house in a given city, basing on the difference between house prices and the Millennials' earnings in the given area. The Millennials who want to buy a house in San Jose need to earn 80,162 U.S. dollars more per year to afford an average house mortgage.
Advertisement
Advertisement
Housing affordability index among Millennials in the United States as of June 2015, by city
(in U.S. dollars per year)
Characteristic
Affordability index in U.S. dollars per year
San Jose, CA
-80,162
San Francisco, CA
-60,975
Los Angeles, CA
-45,761
San Diego, CA
-36,084
Sacramento, CA
-6,636
New York, NY
-6,550
Seattle, WA
-5,778
Riverside, CA
-5,389
Washington, DC
-5,157
Boston, MA
-4,394
Miami-Fort Lauderdale, FL
-4,033
Denver, CO
-2,620
Portland, OR
-1,339
Created with Highcharts 7.2.2Affordability index in U.S. dollars per year-80,162-80,162-60,975-60,975-45,761-45,761-36,084-36,084-6,636-6,636-6,550-6,550-5,778-5,778-5,389-5,389-5,157-5,157-4,394-4,394-4,033-4,033-2,620-2,620-1,339-1,3393,1083,1084,6244,6245,2875,2876,1786,1786,8536,8537,2437,2437,6487,6489,7989,79810,05710,05710,45710,45710,50910,50911,12211,12211,58911,58911,60711,60711,87911,87912,07412,07412,13612,13612,36312,36312,94812,94813,06613,06613,19513,19513,32213,32213,40113,40114,80714,80715,23615,23615,54115,54116,35116,35117,74117,74117,74717,74718,02218,02218,26318,26318,46018,46018,73418,73418,75218,75218,96918,96920,71220,71221,20721,207San Jose, CASan Francisco, CALos Angeles, CASan Diego, CASacramento, CANew York, NYSeattle, WARiverside, CAWashington, DCBoston, MAMiami-Fort Lauderdale, FLDenver, COPortland, ORSalt Lake City, UTVirginia Beach, VAAustin, TXProvidence, RILas Vegas, NVPhoenix, AZOrlando, FLBaltimore, MDNashville, TNMilwaukee, WIPhiladelphia, PARaleigh, NCTampa, FLNew Orleans, LASan Antonio, TXMinneapolis-St Paul, MNJacksonville, FLRichmond, VAChicago, ILCharlotte, NCDallas-Fort Worth, TXHartford, CTHouston, TXAtlanta, GAOklahoma City, OKLouisville, KYColumbus, OHSt. Louis, MOBirmingham, ALCincinnati, OHMemphis, TNKansas City, MOCleveland, OHIndianapolis, INBuffalo, NYPittsburgh, PADetroit, MI
You have no right to use this feature.
Make sure to contact us if you are interested in scientific citation.
You can upgrade your account to enable this functionality for all statistics.
This feature is not available with your current account.Request access
*The source adds the following information: "Fifty largest U.S. cities are ranked based on the monetary gap between the median earnings of millennials and the minimum earnings required to purchase a single family home for the given region. Home values, sourced from Zillow, are based on January to April 2015 monthly median values for detached single family homes within a given region. Millennials' earnings estimations are based on 2013 median earnings for workers ages 18 to 34 years old from the Census Bureau, assuming an escalation of 2 percent per year. The mortgage payment calculation assumed a standard 20 percent down payment and state-based monthly average of 30-year fixed rates in 2015, or jumbo rates if the home value was higher than 417,000 U.S. dollars. Minimum salary required was the inferred amount, assuming one-third of the pre-tax income goes to mortgage payment."
Learn more about how Statista can support your business.
Bloomberg. (June 8, 2015). Housing affordability index among Millennials in the United States as of June 2015, by city (in U.S. dollars per year) [Graph]. In Statista. Retrieved August 14, 2025, from https://www.statista.com/statistics/418607/millenial-housing-affordability-by-city-usa/
Bloomberg. "Housing affordability index among Millennials in the United States as of June 2015, by city (in U.S. dollars per year)." Chart. June 8, 2015. Statista. Accessed August 14, 2025. https://www.statista.com/statistics/418607/millenial-housing-affordability-by-city-usa/
Bloomberg. (2015). Housing affordability index among Millennials in the United States as of June 2015, by city (in U.S. dollars per year). Statista. Statista Inc.. Accessed: August 14, 2025. https://www.statista.com/statistics/418607/millenial-housing-affordability-by-city-usa/
Bloomberg. "Housing Affordability Index among Millennials in The United States as of June 2015, by City (in U.S. Dollars per Year)." Statista, Statista Inc., 8 Jun 2015, https://www.statista.com/statistics/418607/millenial-housing-affordability-by-city-usa/
Bloomberg, Housing affordability index among Millennials in the United States as of June 2015, by city (in U.S. dollars per year) Statista, https://www.statista.com/statistics/418607/millenial-housing-affordability-by-city-usa/ (last visited August 14, 2025)
Housing affordability index among Millennials in the United States as of June 2015, by city (in U.S. dollars per year) [Graph], Bloomberg, June 8, 2015. [Online]. Available: https://www.statista.com/statistics/418607/millenial-housing-affordability-by-city-usa/
Advertisement
Profit from additional features with an Employee Account
Please create an employee account to be able to mark statistics as favorites.
Then you can access your favorite statistics via the star in the header.
Profit from the additional features of your individual account
Currently, you are using a shared account. To use individual functions (e.g., mark statistics as favourites, set
statistic alerts) please log in with your personal account.
If you are an admin, please authenticate by logging in again.