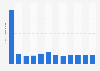
This statistic shows the market share of Irish beef exports between 2013 to 2016, by market. In 2015, the United Kingdom accounted for 54 percent of all Irish beef exports, decreasing to 50 percent in 2016 following Brexit.
Distribution of markets for export of Irish beef from 2013 to 2016
Basic Account
Get to know the platform
You only have access to basic statistics.
This statistic is not included in your account.
Starter Account
The ideal entry-level account for individual users
- Instant access to 1m statistics
- Download in XLS, PDF & PNG format
- Detailed references
$199 USD / Month *
Professional Account
Full access
Business Solutions including all features.
* Prices do not include sales tax.
Other statistics that may interest you Statistics on
About the industry
10
- Premium Statistic Irish pigmeat export market distribution 2013-2018
- Premium Statistic Bacon and ham import value in the United Kingdom (UK) 2007-2022
- Premium Statistic Meat export value in the United Kingdom (UK) 2003-2022
- Premium Statistic Lamb and mutton export value in the United Kingdom (UK) 2007-2022
- Premium Statistic Pork export value in the United Kingdom (UK) 2007-2022
- Premium Statistic Market distribution of Irish dairy exports 2013-2016
- Premium Statistic Irish food and drink exports value 2022, by category
- Premium Statistic Breakfast cereals export value in the United Kingdom (UK) 2007-2022
- Premium Statistic Breakfast cereals import value in the United Kingdom (UK) 2007-2022
- Premium Statistic Dairy import value in the United Kingdom (UK) 2003-2022
About the region
9
- Premium Statistic Change of Irish food and drink export 2022, by category
- Basic Statistic United Kingdom: Food prices in selected EU countries compared to the UK 2016, by food
- Basic Statistic Turnover of the food & beverage service industry in Ireland 2013-2022
- Basic Statistic Personnel costs of the food & beverage service industry in Ireland 2012-2021
- Basic Statistic Ireland: monthly CPI for food and non-alcoholic beverages 2019-2020
- Premium Statistic Number of enterprises in the food manufacturing industry in Ireland 2017
- Premium Statistic Foodservice market spending in Ireland 2017-2020, by sector
- Premium Statistic Forecast CAGR in the quick service and food-to-go market in Ireland 2018-2020
- Premium Statistic Import value of sweet biscuits into Ireland 2016, by country of origin
Selected statistics
9
- Basic Statistic Household food and drink waste cost distribution in the UK 2012, by food group
- Premium Statistic Mondelez International's net revenue distribution worldwide by sector 2022
- Premium Statistic Mondelez International's operating income worldwide 2011-2022
- Premium Statistic Mondelez International's global workforce by region 2012-2022
- Premium Statistic Kellanova Company's net sales worldwide 2004-2023
- Premium Statistic Net sales of ConAgra Brands worldwide 2012-2023
- Premium Statistic Net sales of ConAgra Brands worldwide 2015-2023, by segment
- Premium Statistic Heinz Company's net sales worldwide 2013-2014
- Premium Statistic Kraft Foods Group's net revenue distribution in North America by sector 2011-2014
Other regions
10
- Premium Statistic Coffee import value into Hungary 2011-2023
- Premium Statistic Coffee import value into Slovakia 2011-2020
- Premium Statistic Coffee import value into Czechia 2011-2022
- Premium Statistic Milk and cream import value in MENA 2017 by country
- Premium Statistic Number of fruit juice manufacturers in the EU 2017-2020, by country
- Premium Statistic Coffee import value into Switzerland 2011-2022
- Premium Statistic Coffee import value into Romania 2011-2022
- Premium Statistic Leading companies in meat processing in the Netherlands 2022, by revenue
- Premium Statistic Sugar export value in the United Kingdom (UK) 2003-2022
- Premium Statistic Consumption frequency of meat in Belgium 2023
Related statistics
10
- Premium Statistic Sugar import value in the United Kingdom (UK) 2003-2022
- Premium Statistic Beef and veal import value in the United Kingdom (UK) 2007-2022
- Premium Statistic Milk and cream export value in the United Kingdom (UK) 2007-2022
- Premium Statistic Animal feed import value in the United Kingdom (UK) 2003-2022
- Premium Statistic Lamb and mutton import value in the United Kingdom (UK) 2007-2022
- Premium Statistic Dairy exports value in the United Kingdom (UK) 2003-2022
- Premium Statistic Milk and cream import value in the United Kingdom (UK) 2007-2022
- Premium Statistic Eggs and egg products export value in the United Kingdom (UK) 2003-2022
- Premium Statistic Fish export value in the United Kingdom (UK) 2003-2022
- Premium Statistic Butter import value in the United Kingdom (UK) 2007-2022
Further related statistics
10
- Export distribution of JBS worldwide by country 2014
- Flowers Foods: sales in the U.S. 2010-2023
- Flowers Foods: net income in the U.S. 2010-2022
- Flowers Foods: U.S. sales 2021-2022, by retail segment
- Flowers Foods: sales share in the U.S. 2021 & 2022, by segment
- Hormel Foods' net sales worldwide 2012-2023
- Global revenue of the chemical industry 2017-2022, by region
- Construction exports worldwide 2020-2021, by country
- Total value of U.S. clothing imports 2011-2022
- Gross gambling yield of the gambling industry in Great Britain 2015-2022, by sector
Further Content: You might find this interesting as well
Statistics
- Export distribution of JBS worldwide by country 2014
- Flowers Foods: sales in the U.S. 2010-2023
- Flowers Foods: net income in the U.S. 2010-2022
- Flowers Foods: U.S. sales 2021-2022, by retail segment
- Flowers Foods: sales share in the U.S. 2021 & 2022, by segment
- Hormel Foods' net sales worldwide 2012-2023
- Global revenue of the chemical industry 2017-2022, by region
- Construction exports worldwide 2020-2021, by country
- Total value of U.S. clothing imports 2011-2022
- Gross gambling yield of the gambling industry in Great Britain 2015-2022, by sector
Bord Bia. (January 1, 2017). Distribution of markets for export of Irish beef from 2013 to 2016 [Graph]. In Statista. Retrieved May 21, 2024, from https://www.statista.com/statistics/410787/ireland-beef-exports-market-distribution/
Bord Bia. "Distribution of markets for export of Irish beef from 2013 to 2016." Chart. January 1, 2017. Statista. Accessed May 21, 2024. https://www.statista.com/statistics/410787/ireland-beef-exports-market-distribution/
Bord Bia. (2017). Distribution of markets for export of Irish beef from 2013 to 2016. Statista. Statista Inc.. Accessed: May 21, 2024. https://www.statista.com/statistics/410787/ireland-beef-exports-market-distribution/
Bord Bia. "Distribution of Markets for Export of Irish Beef from 2013 to 2016." Statista, Statista Inc., 1 Jan 2017, https://www.statista.com/statistics/410787/ireland-beef-exports-market-distribution/
Bord Bia, Distribution of markets for export of Irish beef from 2013 to 2016 Statista, https://www.statista.com/statistics/410787/ireland-beef-exports-market-distribution/ (last visited May 21, 2024)
Distribution of markets for export of Irish beef from 2013 to 2016 [Graph], Bord Bia, January 1, 2017. [Online]. Available: https://www.statista.com/statistics/410787/ireland-beef-exports-market-distribution/