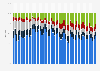
The statistic shows a distribution of Apple's unit sales by product/operating segment from the first quarter of 2012 to the forth quarter of 2018. In the forth quarter of its 2018 fiscal year around 76 percent of Apple's unit sales were iPhones.
Share of Apple's unit sales by product/operating segment from the 1st quarter of 2012 to the 4th quarter of 2018
Adjust the presentation of the statistic and data points.
Share the statistic on social media channels or embed the statistic in your
website using "Embed Code", where available.
Cite this statistic and select one of the following formats: APA, Chicago, Harvard, MLA & Bluebook.
Print the statistic including description and metadata.
Chart type
Share of Apple's unit sales by product/operating segment from the 1st quarter of 2012 to the 4th quarter of 2018
Share this statistic
You have no right to use this feature.
Make sure to contact us if you are interested in scientific citation.
You can upgrade your account to enable this functionality for all statistics.
This feature is not available with your current account.Request access
The quarterly periods for Apple's fiscal year include the following: early October to late December of the previous year (first quarter), early January to late March of the stated year (second quarter), early April to late June of the stated year (3rd quarter) and early July to late September of the stated year (4th quarter).
* Includes deferrals and amortization of related non-software services and software upgrade rights.
Apple stopped reporting unit sales figures from 1st quarter 2019.
Statista has been my savior on several occasions.
The site is easy to maneuver and the data is in a format that can
go right into a report or presentation.
Learn more about how Statista can support your business.
Apple. (November 1, 2018). Share of Apple's unit sales by product/operating segment from the 1st quarter of 2012 to the 4th quarter of 2018 [Graph]. In Statista. Retrieved April 03, 2025, from https://www.statista.com/statistics/382310/share-of-unit-sales-of-apple-by-product-category/
Apple. "Share of Apple's unit sales by product/operating segment from the 1st quarter of 2012 to the 4th quarter of 2018." Chart. November 1, 2018. Statista. Accessed April 03, 2025. https://www.statista.com/statistics/382310/share-of-unit-sales-of-apple-by-product-category/
Apple. (2018). Share of Apple's unit sales by product/operating segment from the 1st quarter of 2012 to the 4th quarter of 2018. Statista. Statista Inc.. Accessed: April 03, 2025. https://www.statista.com/statistics/382310/share-of-unit-sales-of-apple-by-product-category/
Apple. "Share of Apple's Unit Sales by Product/Operating Segment from The 1st Quarter of 2012 to The 4th Quarter of 2018." Statista, Statista Inc., 1 Nov 2018, https://www.statista.com/statistics/382310/share-of-unit-sales-of-apple-by-product-category/
Apple, Share of Apple's unit sales by product/operating segment from the 1st quarter of 2012 to the 4th quarter of 2018 Statista, https://www.statista.com/statistics/382310/share-of-unit-sales-of-apple-by-product-category/ (last visited April 03, 2025)
Share of Apple's unit sales by product/operating segment from the 1st quarter of 2012 to the 4th quarter of 2018 [Graph], Apple, November 1, 2018. [Online]. Available: https://www.statista.com/statistics/382310/share-of-unit-sales-of-apple-by-product-category/
Profit from additional features with an Employee Account
Please create an employee account to be able to mark statistics as favorites.
Then you can access your favorite statistics via the star in the header.
Profit from the additional features of your individual account
Currently, you are using a shared account. To use individual functions (e.g., mark statistics as favourites, set
statistic alerts) please log in with your personal account.
If you are an admin, please authenticate by logging in again.