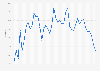
The Americas region accounted for the largest share of Apple’s revenue in terms of geographical distribution. As of the second quarter of fiscal year 2024, the Americas held around 41 percent of the revenue, whereas Europe came in second with roughly over 26.5 percent. Apple’s revenue tends to be the highest in the first quarters of every financial year (October to December), when the holiday seasons take place.
iPhone's prominence
First introduced in 2007, the iPhone has been described as “revolutionary” for the mobile phones industry with its unique designs, features, and services. Despite a slight fluctuations in the share of Apple’s revenue, iPhone still generates the largest part of the company’s revenue. Within the smartphone industry, iPhones composed 17.3 percent of the total smartphone sales globally in the first quarter of 2024.
Smartphones global picture
Looking at the global smartphone market over the years, Apple and Samsung have been the main competitors until recent years, when the Chinese brands Huawei and Xiaomi started to grow rapidly. According to the most recent data, Samsung was positioned first, closely followed Apple.
Share of Apple's revenue by geographical region from the 1st quarter of 2012 to the 2nd quarter of 2024
Characteristic
Americas
Europe
Greater China
Japan
Rest of Asia Pacific
-
-
-
-
-
-
-
-
-
-
-
-
-
-
-
-
-
-
-
-
-
-
-
-
-
-
-
-
-
-
-
-
-
-
-
-
-
-
-
-
-
-
-
-
-
-
-
-
-
-
-
-
-
-
-
-
-
-
-
-
-
-
-
-
-
-
-
-
-
-
-
-
-
-
-
-
-
-
-
-
-
-
-
-
-
-
-
-
-
-
-
-
-
-
-
-
-
-
-
-
-
-
-
-
-
-
-
-
-
-
-
-
-
-
-
-
-
-
-
-
-
-
-
-
-
-
-
-
-
-
-
-
-
-
-
-
-
-
-
-
-
-
-
-
-
-
-
-
-
-
-
-
-
-
-
-
-
-
-
-
-
-
-
-
-
-
-
-
-
-
-
-
-
-
-
-
-
-
-
-
-
-
-
-
-
-
-
-
-
-
-
-
-
-
-
-
-
-
-
-
-
-
-
-
-
-
-
-
-
-
-
-
-
-
-
-
-
-
-
-
-
-
-
-
-
-
-
-
-
-
-
-
-
-
-
-
-
-
-
-
-
-
-
-
-
-
-
-
-
-
-
-
-
-
-
-
-
-
-
-
-
-
-
-
-
-
-
-
-
-
-
-
-
-
-
-
-
-
-
-
-
-
-
-
-
-
-
-
-
-
-
-
-
-
-
-
-
-
-
-
Exclusive Premium Statistic
To access all Premium Statistics, you need a paid Statista Account
The quarterly periods for Apple's fiscal year include the following: early October to late December of the previous year (first quarter), early January to late March of the stated year (second quarter), early April to late June of the stated year (3rd quarter) and early July to late September of the stated year (4th quarter).
Data calculated by Statista based on regional sales figure and overall sales figure.
Profit from the additional features of your individual account
Currently, you are using a shared account. To use individual functions (e.g., mark statistics as favourites, set
statistic alerts) please log in with your personal account.
If you are an admin, please authenticate by logging in again.
Learn more about how Statista can support your business.
Apple, & Statista. (May 2, 2024). Share of Apple's revenue by geographical region from the 1st quarter of 2012 to the 2nd quarter of 2024 [Graph]. In Statista. Retrieved July 22, 2024, from https://www.statista.com/statistics/382288/geographical-region-share-of-revenue-of-apple/?locale=en
Apple, und Statista. "Share of Apple's revenue by geographical region from the 1st quarter of 2012 to the 2nd quarter of 2024." Chart. May 2, 2024. Statista. Accessed July 22, 2024. https://www.statista.com/statistics/382288/geographical-region-share-of-revenue-of-apple/?locale=en
Apple, Statista. (2024). Share of Apple's revenue by geographical region from the 1st quarter of 2012 to the 2nd quarter of 2024. Statista. Statista Inc.. Accessed: July 22, 2024. https://www.statista.com/statistics/382288/geographical-region-share-of-revenue-of-apple/?locale=en
Apple, and Statista. "Share of Apple's Revenue by Geographical Region from The 1st Quarter of 2012 to The 2nd Quarter of 2024." Statista, Statista Inc., 2 May 2024, https://www.statista.com/statistics/382288/geographical-region-share-of-revenue-of-apple/?locale=en
Apple & Statista, Share of Apple's revenue by geographical region from the 1st quarter of 2012 to the 2nd quarter of 2024 Statista, https://www.statista.com/statistics/382288/geographical-region-share-of-revenue-of-apple/?locale=en (last visited July 22, 2024)
Share of Apple's revenue by geographical region from the 1st quarter of 2012 to the 2nd quarter of 2024 [Graph], Apple, & Statista, May 2, 2024. [Online]. Available: https://www.statista.com/statistics/382288/geographical-region-share-of-revenue-of-apple/?locale=en