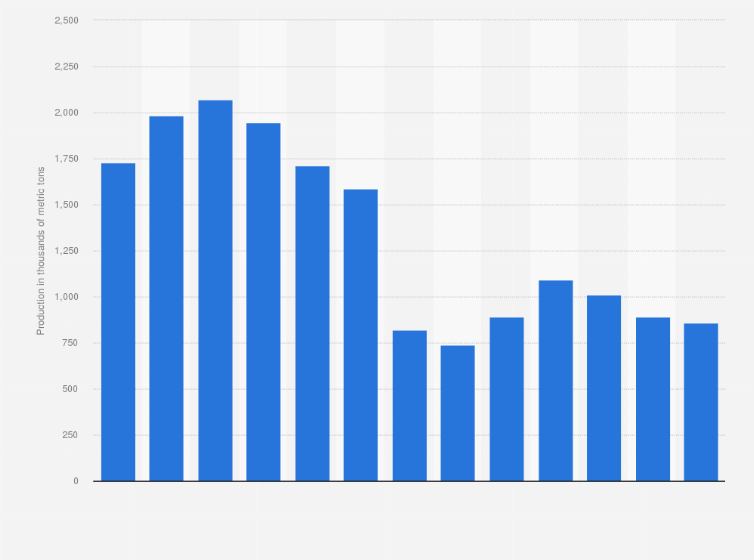
Primary production of aluminum in the United States slumped to some 750,000 metric tons in 2023, representing a 15 percent decrease compared to the previous year.
Fending off imports
Aluminum imports have fluctuated in recent years, with the Covid-19 pandemic contributing to a significant year-on-year contraction of over 19 percent between 2019 and 2020. The United States aims to boost domestic production by becoming less dependent on imports, and less dependent on aluminum producers such as China and India. Not only is China the world’s largest producer, but the country is also the largest consumer of primary aluminum, accounting for half of the global demand.
About aluminum
Aluminum is one of the most commonly used metals in the world due to its light weight, non-corrosiveness, and high strength. The commodity is used in packaging, building, electronics, and vehicle manufacturing. The base metal is also widely recycled, with over 90 percent of all primary produced aluminum still in production. In 2023, around 1.5 million metric tons of aluminum used in secondary production came from old scraps of the metal.
Primary aluminum production in the United States from 2010 to 2023
(in 1,000 metric tons)
Adjust the presentation of the statistic and data points.
Share the statistic on social media channels or embed the statistic in your
website using "Embed Code", where available.
Cite this statistic and select one of the following formats: APA, Chicago, Harvard, MLA & Bluebook.
Print the statistic including description and metadata.
Chart type
Primary aluminum production in the United States from 2010 to 2023
Share this statistic
You have no right to use this feature.
Make sure to contact us if you are interested in scientific citation.
You can upgrade your account to enable this functionality for all statistics.
This feature is not available with your current account.Request access
Learn more about how Statista can support your business.
US Geological Survey. (January 29, 2024). Primary aluminum production in the United States from 2010 to 2023 (in 1,000 metric tons) [Graph]. In Statista. Retrieved April 02, 2025, from https://www.statista.com/statistics/312839/primary-aluminum-production-in-the-united-states/
US Geological Survey. "Primary aluminum production in the United States from 2010 to 2023 (in 1,000 metric tons)." Chart. January 29, 2024. Statista. Accessed April 02, 2025. https://www.statista.com/statistics/312839/primary-aluminum-production-in-the-united-states/
US Geological Survey. (2024). Primary aluminum production in the United States from 2010 to 2023 (in 1,000 metric tons). Statista. Statista Inc.. Accessed: April 02, 2025. https://www.statista.com/statistics/312839/primary-aluminum-production-in-the-united-states/
US Geological Survey. "Primary Aluminum Production in The United States from 2010 to 2023 (in 1,000 Metric Tons)." Statista, Statista Inc., 29 Jan 2024, https://www.statista.com/statistics/312839/primary-aluminum-production-in-the-united-states/
US Geological Survey, Primary aluminum production in the United States from 2010 to 2023 (in 1,000 metric tons) Statista, https://www.statista.com/statistics/312839/primary-aluminum-production-in-the-united-states/ (last visited April 02, 2025)
Primary aluminum production in the United States from 2010 to 2023 (in 1,000 metric tons) [Graph], US Geological Survey, January 29, 2024. [Online]. Available: https://www.statista.com/statistics/312839/primary-aluminum-production-in-the-united-states/
Profit from additional features with an Employee Account
Please create an employee account to be able to mark statistics as favorites.
Then you can access your favorite statistics via the star in the header.
Profit from the additional features of your individual account
Currently, you are using a shared account. To use individual functions (e.g., mark statistics as favourites, set
statistic alerts) please log in with your personal account.
If you are an admin, please authenticate by logging in again.