Many workers in the U.S. rely on the generosity of their customers and clients to take home enough money to pay the bills. With wages traditionally low in the hospitality industry, tipping those working in restaurants and cafes has become a social norm. A recent survey by YouGov though, showed that 44 percent of the public think this system should be scrapped in favor of paying a better wage from the outset (36 percent would keep the tip-based model).
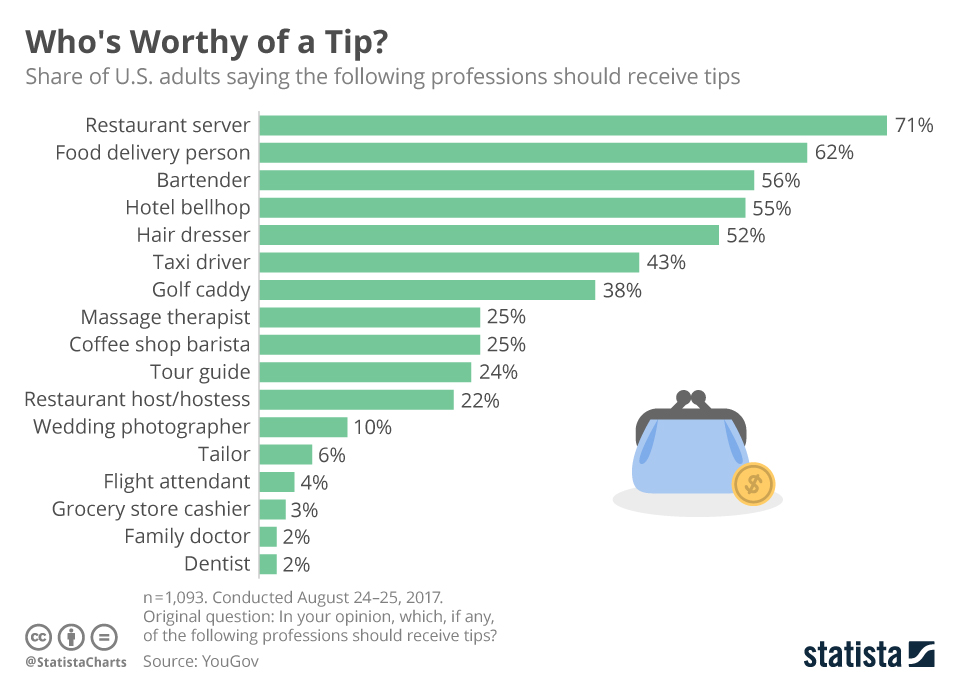
As for the professions deemed most worthy of tips, 71 percent of respondents said that restaurant workers should receive them. Hospitality jobs dominate the top of the list, with food delivers, bartenders and hotel bellhops all enjoying the support of the majority of those surveyed.
Who's Worthy of a Tip?
Work