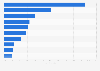
Operating income at PSA Group jumped by over 1.3 billion euros between the 2017 and 2018 fiscal years to stand at 4.4 billion euros in 2018. The automotive manufacturer saw record sales of 3.9 million units worldwide in 2018, after acquiring GM's Opel and Vauxhall brands in March 2017. In 2019, PSA and Fiat Chrysler Automobiles have announced to merge and create the world's fourth largest automaker.
PSA light commercial vehicles
High takes of revenue by PSA was, in part, thanks to a successful light commercial vehicle operation. In 2018, over 564,000 LCVs were sold by the group. In Europe, the group’s most important regional market, PSA-manufactured vehicles accounted for nearly one in every four new LCV sales. PSA brands Peugeot, Citroen, and Opel-Vauxhall are among the most popular vans and light commercial vehicles in Europe. Some vans are also sold under passenger car variants with appropriate seating and surround sound.
Tapping into new markets
Functional and fuel efficient cars are becoming more popular among the young. In France, the word for car, la bagnole, is often used by young people when referring specifically to Peugeot and Citroen vehicles. France and the United Kingdom are the largest regions within Europe for light commercial vehicle sales. Van culture is apparent in both countries, with many workers and companies requiring vans as an essential part of their business. PSA will aim to capitalize on the sustainable growth of the LCV market between 2018 and 2020.
PSA Group's operating income from FY 2011 to FY 2019
(in million euros)
Profit from the additional features of your individual account
Currently, you are using a shared account. To use individual functions (e.g., mark statistics as favourites, set
statistic alerts) please log in with your personal account.
If you are an admin, please authenticate by logging in again.
Learn more about how Statista can support your business.
PSA Peugeot Citroën. (February 26, 2020). PSA Group's operating income from FY 2011 to FY 2019 (in million euros) [Graph]. In Statista. Retrieved October 02, 2024, from https://www.statista.com/statistics/278338/operating-income-of-psa-peugeot-citroen/
PSA Peugeot Citroën. "PSA Group's operating income from FY 2011 to FY 2019 (in million euros)." Chart. February 26, 2020. Statista. Accessed October 02, 2024. https://www.statista.com/statistics/278338/operating-income-of-psa-peugeot-citroen/
PSA Peugeot Citroën. (2020). PSA Group's operating income from FY 2011 to FY 2019 (in million euros). Statista. Statista Inc.. Accessed: October 02, 2024. https://www.statista.com/statistics/278338/operating-income-of-psa-peugeot-citroen/
PSA Peugeot Citroën. "Psa Group's Operating Income from Fy 2011 to Fy 2019 (in Million Euros)." Statista, Statista Inc., 26 Feb 2020, https://www.statista.com/statistics/278338/operating-income-of-psa-peugeot-citroen/
PSA Peugeot Citroën, PSA Group's operating income from FY 2011 to FY 2019 (in million euros) Statista, https://www.statista.com/statistics/278338/operating-income-of-psa-peugeot-citroen/ (last visited October 02, 2024)
PSA Group's operating income from FY 2011 to FY 2019 (in million euros) [Graph], PSA Peugeot Citroën, February 26, 2020. [Online]. Available: https://www.statista.com/statistics/278338/operating-income-of-psa-peugeot-citroen/