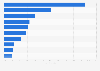
PSA Peugeot Citroen’s largest market, Europe, generated some 58.8 billion euros in 2019. The company’s mass produced brands are among the most popular in Europe. Global revenues at PSA Group increased by 700 million euros between 2018 and 2019.
The world’s fourth largest auto manufacturer?
In the Fall of 2019, PSA and Fiat Chrysler Automobiles announced the two companies would merge. Fiat Chrysler Automobiles owns some of North America’s most popular brands such as Dodge, Ram, and Jeep. Fiat Chrysler Automobiles sold roughly 4.27 million units worldwide in 2019. This means that the new entity would become among the largest motor vehicle manufacturers in the world. The merger aimed to facilitate cost effective development programs in electrification and automation as the automotive industry makes a paradigm shift. The merger also opens up the North American market to many PSA brands. North America is the largest market for Fiat Chrysler Automobiles.
PSA Group's revenue of FY 2019, by region
(in million euros)
* Includes China, South-Asia, and India Pacific; these segments have been added up One euro bought approximately 1.12 U.S. dollars as of December 31, 2019. Fiscal year ended December 31.
Profit from the additional features of your individual account
Currently, you are using a shared account. To use individual functions (e.g., mark statistics as favourites, set
statistic alerts) please log in with your personal account.
If you are an admin, please authenticate by logging in again.
Learn more about how Statista can support your business.
PSA Peugeot Citroën. (February 25, 2020). PSA Group's revenue of FY 2019, by region (in million euros) [Graph]. In Statista. Retrieved December 23, 2024, from https://www.statista.com/statistics/278336/revenue-of-psa-peugeot-citroen-by-region/
PSA Peugeot Citroën. "PSA Group's revenue of FY 2019, by region (in million euros)." Chart. February 25, 2020. Statista. Accessed December 23, 2024. https://www.statista.com/statistics/278336/revenue-of-psa-peugeot-citroen-by-region/
PSA Peugeot Citroën. (2020). PSA Group's revenue of FY 2019, by region (in million euros). Statista. Statista Inc.. Accessed: December 23, 2024. https://www.statista.com/statistics/278336/revenue-of-psa-peugeot-citroen-by-region/
PSA Peugeot Citroën. "Psa Group's Revenue of Fy 2019, by Region (in Million Euros)." Statista, Statista Inc., 25 Feb 2020, https://www.statista.com/statistics/278336/revenue-of-psa-peugeot-citroen-by-region/
PSA Peugeot Citroën, PSA Group's revenue of FY 2019, by region (in million euros) Statista, https://www.statista.com/statistics/278336/revenue-of-psa-peugeot-citroen-by-region/ (last visited December 23, 2024)
PSA Group's revenue of FY 2019, by region (in million euros) [Graph], PSA Peugeot Citroën, February 25, 2020. [Online]. Available: https://www.statista.com/statistics/278336/revenue-of-psa-peugeot-citroen-by-region/