


Tiago Bianchi
Research expert covering internet & gaming in Latin America and Spain
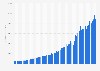
Get in touch with us nowIn the second quarter of 2024, Google's lobbying expenses in the United States amounted to 2.92 million U.S. dollars. This represents a slight decrease from the previous quarter when the online company spent 3.08 million U.S. dollars to promote its interests with decision-making legislative bodies in the United States.
* For commercial use only
Basic Account
Starter Account
Professional Account
1 All prices do not include sales tax. The account requires an annual contract and will renew after one year to the regular list price.
Everything on "Alphabet Inc." in one document: edited and divided into chapters, including detailed references.
I think of Statista as Google for researchers. Statista provides you with the information you search for right away.
Dr. Horst Stipp
EVP, Research & Innovation, Advertising Research Foundation
Company financials
Benchmark
Segments
Search
YouTube
Google Play
Government
Environmental impact
Further related statistics
* For commercial use only
Basic Account
Starter Account
Professional Account
1 All prices do not include sales tax. The account requires an annual contract and will renew after one year to the regular list price.


