In the second quarter of 2024, Samsung achieved a revenue of 9.82 billion U.S. dollars from global DRAM sales, up from the 4.53 billion U.S. dollars the company achieved during the same quarter of 2023. SK Hynix, who ranked second among vendors, generated revenues of 7.91 billion U.S. dollars from global DRAM sales in the second quarter of 2024. Overall DRAM revenues amounted to 22.9 billion U.S. dollars for the quarter, up from the 18.35 billion U.S. dollars observed in the first quarter of 2024.
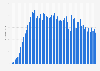
DRAM manufacturers revenue worldwide from 2011 to 2024, by quarter
(in million U.S. dollars)
Figures up to the first quarter of 2012, and also in the first quarter of 2013 were taken from IHS. The remaining figures were taken from DRAMeXchange and TrendForce.
Profit from the additional features of your individual account
Currently, you are using a shared account. To use individual functions (e.g., mark statistics as favourites, set
statistic alerts) please log in with your personal account.
If you are an admin, please authenticate by logging in again.
Learn more about how Statista can support your business.
DRAMeXchange, & IHS, & TrendForce. (August 15, 2024). DRAM manufacturers revenue worldwide from 2011 to 2024, by quarter (in million U.S. dollars) [Graph]. In Statista. Retrieved December 21, 2024, from https://www.statista.com/statistics/271725/global-dram-revenues-of-semiconductor-companies-since-2010/
DRAMeXchange, und IHS, und TrendForce. "DRAM manufacturers revenue worldwide from 2011 to 2024, by quarter (in million U.S. dollars)." Chart. August 15, 2024. Statista. Accessed December 21, 2024. https://www.statista.com/statistics/271725/global-dram-revenues-of-semiconductor-companies-since-2010/
DRAMeXchange, IHS, TrendForce. (2024). DRAM manufacturers revenue worldwide from 2011 to 2024, by quarter (in million U.S. dollars). Statista. Statista Inc.. Accessed: December 21, 2024. https://www.statista.com/statistics/271725/global-dram-revenues-of-semiconductor-companies-since-2010/
DRAMeXchange, and IHS, and TrendForce. "Dram Manufacturers Revenue Worldwide from 2011 to 2024, by Quarter (in Million U.S. Dollars)." Statista, Statista Inc., 15 Aug 2024, https://www.statista.com/statistics/271725/global-dram-revenues-of-semiconductor-companies-since-2010/
DRAMeXchange & IHS & TrendForce, DRAM manufacturers revenue worldwide from 2011 to 2024, by quarter (in million U.S. dollars) Statista, https://www.statista.com/statistics/271725/global-dram-revenues-of-semiconductor-companies-since-2010/ (last visited December 21, 2024)
DRAM manufacturers revenue worldwide from 2011 to 2024, by quarter (in million U.S. dollars) [Graph], DRAMeXchange, & IHS, & TrendForce, August 15, 2024. [Online]. Available: https://www.statista.com/statistics/271725/global-dram-revenues-of-semiconductor-companies-since-2010/