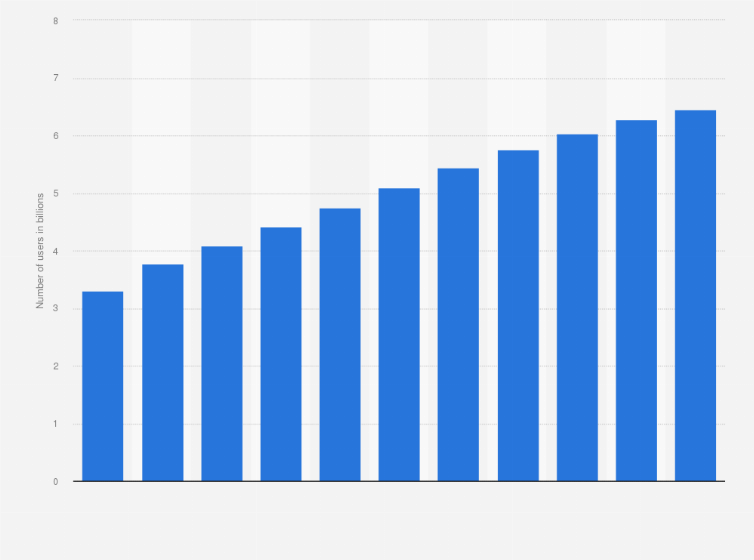
Share of population in the U.S. vaccinated against COVID-19, Apr. 26, 2023, by state

Percentage of U.S. population who had been given a COVID-19 vaccination as of April 26, 2023, by state or territory

CharacteristicGiven 1+ doseFully vaccinatedUpdated (bivalent) booster dose*
United States 81.3% 69.4% 16.8%
Rhode Island 95% 88% 25.6%
American Samoa 95% 89.6% 1.2%
District of Columbia 95% 91.2% 31.9%
Massachusetts 95% 84.5% 30.8%
Vermont 95% 86% 33.8%
Maine 95% 83.6% 30.7%
Connecticut 95% 83.2% 25.3%
Republic of Palau 95% 86.2% 9.3%
New Jersey 94.9% 79.3% 16.9%
Guam 94.8% 86% 10.7%
New Mexico 94.8% 75.4% 22%
New York State 94.7% 81% 17.5%
Created with Highcharts 7.2.2Percentage of population16.8%16.8%25.6%25.6%1.2%1.2%31.9%31.9%30.8%30.8%33.8%33.8%30.7%30.7%25.3%25.3%9.3%9.3%16.9%16.9%10.7%10.7%22%22%17.5%17.5%24.1%24.1%22.6%22.6%20.9%20.9%10.4%10.4%18.7%18.7%9.2%9.2%14.7%14.7%23.5%23.5%21%21%25.7%25.7%20.4%20.4%16.2%16.2%17.5%17.5%21.7%21.7%11.5%11.5%22.2%22.2%26.6%26.6%20.2%20.2%15.5%15.5%12.9%12.9%11.1%11.1%15.7%15.7%14.5%14.5%22.6%22.6%12%12%17.5%17.5%14%14%11.6%11.6%3.9%3.9%19.9%19.9%10.9%10.9%17.8%17.8%15.7%15.7%14.7%14.7%12.5%12.5%10.5%10.5%15.8%15.8%11.6%11.6%16.1%16.1%7.6%7.6%10.2%10.2%11%11%13.7%13.7%7.6%7.6%6.6%6.6%11.2%11.2%7.4%7.4%69.4%69.4%88%88%89.6%89.6%91.2%91.2%84.5%84.5%86%86%83.6%83.6%83.2%83.2%86.2%86.2%79.3%79.3%86%86%75.4%75.4%81%81%79.9%79.9%81.7%81.7%76.8%76.8%84.2%84.2%73.7%73.7%84.9%84.9%66.9%66.9%72.2%72.2%73.5%73.5%76.3%76.3%74.9%74.9%72%72%66.5%66.5%73.7%73.7%69.7%69.7%72.6%72.6%72.4%72.4%71.4%71.4%66.2%66.2%63.8%63.8%63.5%63.5%65.5%65.5%66.9%66.9%68.4%68.4%60.6%60.6%66.5%66.5%65.3%65.3%60%60%55.6%55.6%64.5%64.5%57%57%62.6%62.6%58.9%58.9%59.2%59.2%59.7%59.7%57.5%57.5%59.3%59.3%59.8%59.8%60.6%60.6%53.2%53.2%56.4%56.4%57.9%57.9%56.6%56.6%55.1%55.1%53.8%53.8%53.1%53.1%46.2%46.2%81.3%81.3%95%95%95%95%95%95%95%95%95%95%95%95%95%95%95%95%94.9%94.9%94.8%94.8%94.8%94.8%94.7%94.7%92%92%91.6%91.6%91.3%91.3%91%91%91%91%90.3%90.3%90.1%90.1%88.5%88.5%88.5%88.5%85.5%85.5%85%85%84.2%84.2%84.2%84.2%83.9%83.9%82.9%82.9%82%82%79.1%79.1%79.1%79.1%78.3%78.3%77.9%77.9%76.9%76.9%76.5%76.5%75.5%75.5%75.3%75.3%74.8%74.8%73.7%73.7%73.2%73.2%71.2%71.2%70.9%70.9%70.8%70.8%70.1%70.1%69.9%69.9%69.6%69.6%69.5%69.5%69%69%68.6%68.6%68.4%68.4%67.6%67.6%65.9%65.9%65.1%65.1%64.6%64.6%64.6%64.6%64.1%64.1%62.9%62.9%61.8%61.8%61.1%61.1%57.3%57.3%Given 1+ doseFully vaccinatedUpdated (bivalent) booster dose*United StatesRhode IslandAmerican SamoaDistrict of ColumbiaMassachusettsVermontMaineConnecticutRepublic of PalauNew JerseyGuamNew MexicoNew York StateMarylandHawaiiVirginiaPuerto RicoPennsylvaniaNorthern Mariana IslandsNorth CarolinaNew HampshireDelawareWashingtonCaliforniaFederated States of MicronesiaSouth DakotaColoradoFloridaOregonMinnesotaIllinoisArizonaNevadaTexasKansasUtahWisconsinOklahomaNebraskaAlaskaSouth CarolinaVirgin IslandsIowaArkansasMichiganNorth DakotaMissouriKentuckyGeorgiaMontanaWest VirginiaOhioAlabamaTennesseeIndianaIdahoLouisianaMississippiWyomingMarshall Islands
0%5%10%15%20%25%30%35%40%45%50%55%60%65%70%75%80%85%90%95%100%105%
Download
Show detailed source information?
Register for free
Already a member?
Log in
Source

Use Ask Statista Research Service

Release date

April 2023

Region

United States

Survey time period

As of April 26, 2023

Supplementary notes

* Only among those aged 18 years and older.

Citation formats
Access all statistics starting from $2,388 USD yearly *

* For commercial use only

Basic Account

For single users
$0 USD
Always free
Access limited to Free Statistics. Premium Statistics are not included.
  • Free Statistics
Based on your interests

Starter Account

For single users
$199 USD
per month, billed annually 1
  • Free Statistics
  • Premium Statistics

Professional Account

For teams of up to 5 people
$1,299 USD
per month, billed annually 1
  • Free + Premium Statistics
  • Reports
  • Market Insights

1 All prices do not include sales tax. The account requires an annual contract and will renew after one year to the regular list price.

Leading companies trust Statista:
paypal google adobe pg samsung telekom

Related reports: Available to download in PDF or PPTX format

All datain one format
All data
in one format
Coronavirus (COVID-19) in the U.S.

Everything on "Coronavirus (COVID-19) in the U.S." in one document: edited and divided into chapters, including detailed references.

Statista has been my savior on several occasions. The site is easy to maneuver and the data is in a format that can go right into a report or presentation.
Marlene Greenfield

Marlene Greenfield
Vice President, Hearst Magazines

Statistics on " Coronavirus (COVID-19) in the U.S. "

Other statistics that may interest you Coronavirus (COVID-19) in the U.S.

Global overview

7

Cases

6

Deaths

6

Cases and deaths by state

4

Vaccinations

8

Public awareness and concern

8

Economic impact

7

Miscellaneous

7

Further related statistics

17

Discover Statista

Need help with using Statista for your research? Tutorials and first steps

Further Content: You might find this interesting as well

Do you have any questions about our business solutions?

We provide you with detailed information about our Professional Account.

Access all statistics starting from $2,388 USD yearly *

* For commercial use only

Basic Account

For single users
$0 USD
Always free
Access limited to Free Statistics. Premium Statistics are not included.
  • Free Statistics
Based on your interests

Starter Account

For single users
$199 USD
per month, billed annually 1
  • Free Statistics
  • Premium Statistics

Professional Account

For teams of up to 5 people
$1,299 USD
per month, billed annually 1
  • Free + Premium Statistics
  • Reports
  • Market Insights

1 All prices do not include sales tax. The account requires an annual contract and will renew after one year to the regular list price.

Learn more about how Statista can support your business.