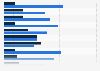
This graph shows the working-age adults to elderly ratio in China from 2000 to 2020 with forecasts until 2100. In 2030, about 2.3 adults are estimated to support one elderly person in China.
Ratio of working-age adults to elderly in China from 2000 to 2020 with forecasts until 2100
Adjust the presentation of the statistic and data points.
Share the statistic on social media channels or embed the statistic in your
website using "Embed Code", where available.
Cite this statistic and select one of the following formats: APA, Chicago, Harvard, MLA & Bluebook.
Print the statistic including description and metadata.
Chart type
Ratio of working-age adults to elderly in China from 2000 to 2020 with forecasts until 2100
Share this statistic
You have no right to use this feature.
Make sure to contact us if you are interested in scientific citation.
You can upgrade your account to enable this functionality for all statistics.
This feature is not available with your current account.Request access
Working-age adults cover persons at age 15 to 59 in China. The retirement age for men in China is 60, while for women working as civil servants is 55 and other working women 50 as of 2019. Estimates for the future are based on a medium variant model.
Learn more about how Statista can support your business.
Statista, & United Nations Department of Economic and Social Affairs (UN DESA). (July 11, 2024). Ratio of working-age adults to elderly in China from 2000 to 2020 with forecasts until 2100 [Graph]. In Statista. Retrieved April 01, 2025, from https://www.statista.com/statistics/251729/ratio-of-working-age-adults-to-elderly-in-china/
Statista, und United Nations Department of Economic and Social Affairs (UN DESA). "Ratio of working-age adults to elderly in China from 2000 to 2020 with forecasts until 2100." Chart. July 11, 2024. Statista. Accessed April 01, 2025. https://www.statista.com/statistics/251729/ratio-of-working-age-adults-to-elderly-in-china/
Statista, United Nations Department of Economic and Social Affairs (UN DESA). (2024). Ratio of working-age adults to elderly in China from 2000 to 2020 with forecasts until 2100. Statista. Statista Inc.. Accessed: April 01, 2025. https://www.statista.com/statistics/251729/ratio-of-working-age-adults-to-elderly-in-china/
Statista, and United Nations Department of Economic and Social Affairs (UN DESA). "Ratio of Working-age Adults to Elderly in China from 2000 to 2020 with Forecasts until 2100." Statista, Statista Inc., 11 Jul 2024, https://www.statista.com/statistics/251729/ratio-of-working-age-adults-to-elderly-in-china/
Statista & United Nations Department of Economic and Social Affairs (UN DESA), Ratio of working-age adults to elderly in China from 2000 to 2020 with forecasts until 2100 Statista, https://www.statista.com/statistics/251729/ratio-of-working-age-adults-to-elderly-in-china/ (last visited April 01, 2025)
Ratio of working-age adults to elderly in China from 2000 to 2020 with forecasts until 2100 [Graph], Statista, & United Nations Department of Economic and Social Affairs (UN DESA), July 11, 2024. [Online]. Available: https://www.statista.com/statistics/251729/ratio-of-working-age-adults-to-elderly-in-china/
Profit from additional features with an Employee Account
Please create an employee account to be able to mark statistics as favorites.
Then you can access your favorite statistics via the star in the header.
Profit from the additional features of your individual account
Currently, you are using a shared account. To use individual functions (e.g., mark statistics as favourites, set
statistic alerts) please log in with your personal account.
If you are an admin, please authenticate by logging in again.