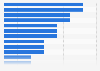
The statistic shows a comparison of regular room rates and Super Bowl XLVI room rates for hotel rooms in Indianapolis in 2012. The Americas Best Value Inn has a regular room rate of 66 U.S. dollars compared to a room rate of 990 U.S. dollars during Super Bowl XLVI.
Regular / Super Bowl weekend hotel room rates in Indianapolis in 2012 (in U.S. dollars)*
Loading statistic...
Basic Account
Get to know the platform
You only have access to basic statistics.
Starter Account
The ideal entry-level account for individual users
- Instant access to 1m statistics
- Download in XLS, PDF & PNG format
- Detailed references
$199 USD / Month *
Professional Account
Full access
Business Solutions including all features.
* Prices do not include sales tax.
Other statistics that may interest you Statistics on
About the industry
9
- Basic Statistic Hotel rates in popular Asian back-packer destinations via mobile booking U.S. 2014
- Premium Statistic Most expensive cities for hotels in the U.S. as of June 2013
- Premium Statistic Change in hotel room stock in Moscow 2017-2027
- Basic Statistic Average monthly hotel prices in Barcelona 2021-2024
- Premium Statistic Hotel ADR growth in hotels in Moscow 2022, by star rating
- Premium Statistic Average daily rate of Hilton Worldwide Holdings hotels 2012-2023
- Premium Statistic Average daily hotel rate in Moscow and Saint Petersburg Q2 2020, by segment
- Basic Statistic Impact of coronavirus (COVID-19) on hotel performance in London 2020
- Premium Statistic Caribbean hotels' average daily rate 2010-2019
About the region
9
- Basic Statistic Hotel rates in popular European capital destinations via mobile booking U.S. 2014
- Basic Statistic Most expensive city hotels in the U.S. as of October 2014
- Premium Statistic Most expensive summer destinations in New York State in 2014
- Premium Statistic Average daily room rate in Las Vegas 2002-2022
- Premium Statistic ADR of hotels in the U.S. 2001-2022
- Basic Statistic Change in revenue per available room in the U.S. lodging industry 2014-2024
- Premium Statistic Importance of price to U.S. leisure travelers when choosing a hotel as of May 2017
- Premium Statistic Countries that spent the most on hotel rates in the U.S. 2016
- Basic Statistic Hotel rates in the most popular summer destinations for travelers from the U.S. 2016
Selected statistics
10
- Premium Statistic Gross revenue of the InterContinental Hotels Group worldwide 2007-2023
- Basic Statistic Total assets of Choice Hotels International worldwide 2008-2023
- Premium Statistic Operating income of the InterContinental Hotels Group 2007-2023
- Premium Statistic Total assets of the InterContinental Hotels Group 2007-2023
- Premium Statistic Revenue of the InterContinental Hotels Group 2007-2023
- Premium Statistic Income of the InterContinental Hotels Group 2007-2023
- Basic Statistic Revenue of the InterContinental Hotels Group 2008-2023, by ownership type
- Premium Statistic Number of employees of the InterContinental Hotel Group 2023
- Premium Statistic Net income of Hyatt Hotels Corporation 2008-2022
- Premium Statistic Total assets of Hyatt Hotels Corporation worldwide 2008-2023
Other regions
10
- Premium Statistic Average daily hotel rates in Paris 2011-2019
- Premium Statistic Average daily hotel rates in Edinburgh 2011-2017
- Premium Statistic Average daily hotel rates in Brussels 2011-2017
- Basic Statistic Annual growth in average global hotel rates 2010-2018
- Premium Statistic Hotel room occupancy in Moscow 2019-2023
- Premium Statistic Average daily hotel rate at popular ski destinations in Andorra and Spain 2016
- Premium Statistic Revenue per available hotel room in Amsterdam 2011-2019
- Premium Statistic Average daily hotel rate in Milan 2011-2019
- Premium Statistic Average daily hotel rates in Zurich 2011-2019
- Premium Statistic Average daily hotel rate in Lisbon 2011-2019
Related statistics
9
- Basic Statistic Countries with the largest decrease in hotel prices in 2015
- Basic Statistic Average global hotel rates from 2009 to 2015
- Premium Statistic Premier Inn: average room rate in the UK 2009-2023
- Basic Statistic RevPAR of Wyndham Hotels & Resorts, Inc. hotels worldwide 2014-2023
- Basic Statistic Global average daily rate of Marriott International hotels 2010-2023, by region
- Premium Statistic Accommodation: Consumer price index (CPI) annual average in the UK 2003-2021
- Premium Statistic Overnight accommodation costs in Vancouver 2023
- Premium Statistic Overnight accommodation costs in London 2019-2022, by month
- Premium Statistic Value per hotel room in New Brunswick 2010-2018
Further related statistics
10
- Revenue of Marriott International worldwide 1999-2023
- Number of Marriott International employees worldwide 2007-2023
- Number of Marriott International hotel rooms worldwide 2009-2023
- Operating income of Marriott International worldwide 2007-2023
- Foreign exchange earnings from tourism in India 2000-2022
- UEFA European Championship commercial revenue 1992-2021
- Extended stay lodging units: total number in the U.S. 2008-2016
- Quarterly average daily rate of hotels in Portland 2016-2017
- Quarterly average daily rate of hotels in Seattle 2016-2017
- Quarterly average daily rate of hotels in San Diego 2016-2017
Further Content: You might find this interesting as well
Statistics
- Revenue of Marriott International worldwide 1999-2023
- Number of Marriott International employees worldwide 2007-2023
- Number of Marriott International hotel rooms worldwide 2009-2023
- Operating income of Marriott International worldwide 2007-2023
- Foreign exchange earnings from tourism in India 2000-2022
- UEFA European Championship commercial revenue 1992-2021
- Extended stay lodging units: total number in the U.S. 2008-2016
- Quarterly average daily rate of hotels in Portland 2016-2017
- Quarterly average daily rate of hotels in Seattle 2016-2017
- Quarterly average daily rate of hotels in San Diego 2016-2017
Cheaphotels.org. (January 27, 2012). Regular / Super Bowl weekend hotel room rates in Indianapolis in 2012 (in U.S. dollars)* [Graph]. In Statista. Retrieved May 23, 2024, from https://www.statista.com/statistics/217048/super-bowl-xlvi-hotel-room-rates/
Cheaphotels.org. "Regular / Super Bowl weekend hotel room rates in Indianapolis in 2012 (in U.S. dollars)*." Chart. January 27, 2012. Statista. Accessed May 23, 2024. https://www.statista.com/statistics/217048/super-bowl-xlvi-hotel-room-rates/
Cheaphotels.org. (2012). Regular / Super Bowl weekend hotel room rates in Indianapolis in 2012 (in U.S. dollars)*. Statista. Statista Inc.. Accessed: May 23, 2024. https://www.statista.com/statistics/217048/super-bowl-xlvi-hotel-room-rates/
Cheaphotels.org. "Regular / Super Bowl Weekend Hotel Room Rates in Indianapolis in 2012 (in U.S. Dollars)*." Statista, Statista Inc., 27 Jan 2012, https://www.statista.com/statistics/217048/super-bowl-xlvi-hotel-room-rates/
Cheaphotels.org, Regular / Super Bowl weekend hotel room rates in Indianapolis in 2012 (in U.S. dollars)* Statista, https://www.statista.com/statistics/217048/super-bowl-xlvi-hotel-room-rates/ (last visited May 23, 2024)
Regular / Super Bowl weekend hotel room rates in Indianapolis in 2012 (in U.S. dollars)* [Graph], Cheaphotels.org, January 27, 2012. [Online]. Available: https://www.statista.com/statistics/217048/super-bowl-xlvi-hotel-room-rates/