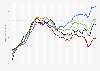
This statistic shows the U.S. merchant wholesalers' gross margin as a share of durable goods sales from 2002 to 2021. In 2021, the gross margin's share of durable goods sales in U.S. wholesale amounted to 26.9 percent. Durable goods include: motor vehicle and motor vehicle parts and supplies; furniture and home furnishings; lumber and other construction materials; professional and commercial equipment and supplies; computer and computer peripheral equipment and software; metals and minerals (excluding petroleum); electrical goods; hardware, and plumbing and heating equipment and supplies; machinery, equipment, and supplies; as well as miscellaneous durable goods.
U.S. merchant wholesalers' gross margin as a share of durable goods sales from 2002 to 2021
Numbers have been rounded to provide a better understanding of the statistic.
Durable goods include: motor vehicle and motor vehicle parts and supplies; furniture and home furnishings; lumber and other construction materials; professional and commercial equipment and supplies; computer and computer peripheral equipment and software; metals and minerals (except petroleum); electrical goods; hardware, and plumbing and heating equipment and supplies; machinery, equipment, and supplies; and miscellaneous durable goods.
Sales and inventory estimates are based on data from the Annual Wholesale Trade Survey. Estimates have been adjusted using the final results of the 2017 Economic Census.
Estimates have not been adjusted for price changes. Additional information on confidentiality protection, sampling error, sample design, and definitions may be found here.
* Revised data.
** Durable and nondurable goods.
Profit from the additional features of your individual account
Currently, you are using a shared account. To use individual functions (e.g., mark statistics as favourites, set
statistic alerts) please log in with your personal account.
If you are an admin, please authenticate by logging in again.
Learn more about how Statista can support your business.
US Census Bureau. (December 14, 2022). U.S. merchant wholesalers' gross margin as a share of durable goods sales from 2002 to 2021 [Graph]. In Statista. Retrieved January 31, 2025, from https://www.statista.com/statistics/199663/share-of-gross-margin-of-durable-goods-sales-in-us-wholesale-since-1993/
US Census Bureau. "U.S. merchant wholesalers' gross margin as a share of durable goods sales from 2002 to 2021." Chart. December 14, 2022. Statista. Accessed January 31, 2025. https://www.statista.com/statistics/199663/share-of-gross-margin-of-durable-goods-sales-in-us-wholesale-since-1993/
US Census Bureau. (2022). U.S. merchant wholesalers' gross margin as a share of durable goods sales from 2002 to 2021. Statista. Statista Inc.. Accessed: January 31, 2025. https://www.statista.com/statistics/199663/share-of-gross-margin-of-durable-goods-sales-in-us-wholesale-since-1993/
US Census Bureau. "U.S. Merchant Wholesalers' Gross Margin as a Share of Durable Goods Sales from 2002 to 2021." Statista, Statista Inc., 14 Dec 2022, https://www.statista.com/statistics/199663/share-of-gross-margin-of-durable-goods-sales-in-us-wholesale-since-1993/
US Census Bureau, U.S. merchant wholesalers' gross margin as a share of durable goods sales from 2002 to 2021 Statista, https://www.statista.com/statistics/199663/share-of-gross-margin-of-durable-goods-sales-in-us-wholesale-since-1993/ (last visited January 31, 2025)
U.S. merchant wholesalers' gross margin as a share of durable goods sales from 2002 to 2021 [Graph], US Census Bureau, December 14, 2022. [Online]. Available: https://www.statista.com/statistics/199663/share-of-gross-margin-of-durable-goods-sales-in-us-wholesale-since-1993/