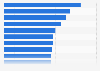
Most of the leading amusement and theme parks worldwide experienced positive growth when it came to attendance in 2023. For instance, five parks located in China welcomed over 100 percent more visitors in 2023 compared to the previous year. The park with the highest change in attendance was Chimelong Ocean Kingdom.
Change in attendance at amusement and theme parks worldwide in 2023, by facility
Characteristic
Attendance change
Chimelong Ocean Kingdom, China
184.5%
Zigong Fantawild Dino Kingdom, China
177.9%
Shanghai Disneyland, China
164.2%
Chimelong Paradise, China
142.6%
Universal Studios Beijing, China
109.3%
Hong Kong Disneyland, Hong Kong SAR
88.2%
Mianyang Fantawild Oriental Heritage, China
76.9%
Universal Studios Japan, Japan
29.6%
Tokyo Disneyland, Japan
25.8%
Tokyo DisneySea, Japan
22.8%
Epcot at Walt Disney World, USA
19.8%
Universal Studios Hollywood, USA
15%
Lotte World, South Korea
14.8%
Disney California Adventure Park, USA
11.1%
Europa-Park, Germany
11.1%
Walt Disney Studios Park at Disneyland Paris, France
6.7%
Disneyland Park at Disneyland Paris, France
4.7%
Magic Kingdom Theme Park at Walt Disney World Resort, USA
3.4%
De Efteling, Netherlands
2.4%
Disneyland Park, USA
2.2%
Everland, South Korea
1.9%
Disney's Animal Kingdom at Walt Disney World, USA
-2.8%
Disney's Hollywood Studios at Walt Disney World, USA
-5.5%
Universal Islands of Adventure at Universal Orlando, USA
-9.3%
Universal Studios Florida at Universal Orlando, USA
Profit from the additional features of your individual account
Currently, you are using a shared account. To use individual functions (e.g., mark statistics as favourites, set
statistic alerts) please log in with your personal account.
If you are an admin, please authenticate by logging in again.
Learn more about how Statista can support your business.
AECOM. (August 15, 2024). Change in attendance at amusement and theme parks worldwide in 2023, by facility [Graph]. In Statista. Retrieved December 23, 2024, from https://www.statista.com/statistics/194286/percentage-change-in-attendance-at-amusement-parks-worldwide/
AECOM. "Change in attendance at amusement and theme parks worldwide in 2023, by facility." Chart. August 15, 2024. Statista. Accessed December 23, 2024. https://www.statista.com/statistics/194286/percentage-change-in-attendance-at-amusement-parks-worldwide/
AECOM. (2024). Change in attendance at amusement and theme parks worldwide in 2023, by facility. Statista. Statista Inc.. Accessed: December 23, 2024. https://www.statista.com/statistics/194286/percentage-change-in-attendance-at-amusement-parks-worldwide/
AECOM. "Change in Attendance at Amusement and Theme Parks Worldwide in 2023, by Facility." Statista, Statista Inc., 15 Aug 2024, https://www.statista.com/statistics/194286/percentage-change-in-attendance-at-amusement-parks-worldwide/
AECOM, Change in attendance at amusement and theme parks worldwide in 2023, by facility Statista, https://www.statista.com/statistics/194286/percentage-change-in-attendance-at-amusement-parks-worldwide/ (last visited December 23, 2024)
Change in attendance at amusement and theme parks worldwide in 2023, by facility [Graph], AECOM, August 15, 2024. [Online]. Available: https://www.statista.com/statistics/194286/percentage-change-in-attendance-at-amusement-parks-worldwide/