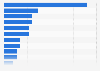
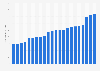
The majority of the people employed in Morocco are men. In 2023, men in employment amounted to around 8.8 million, against 2.7 million women. Additionally, the proportion between female and male employment slowly declined in the period examined. A total of 11.3 million people aged 15 years and older were employed in Morocco in 2023.
Number of people employed in Morocco from 2013 to 2024, by gender
(in 1,000s)
Characteristic
Female
Male
2024
2,691.3
8,764.8
2023
2,645.8
8,692.1
2022
2,582.9
8,634.6
2021
2,461.8
8,528.6
2020
2,562.2
7,770
2019
2,705.9
8,178.7
2018
2,666.2
8,083.1
2017
2,626.2
7,991.6
2016
2,638.4
8,060.8
2015
2,731.4
8,002
2014
2,743.4
7,937.3
2013
2,718.3
7,909.9
Created with Highcharts 7.2.2Number of people employed in thousands2,718.32,718.32,743.42,743.42,731.42,731.42,638.42,638.42,626.22,626.22,666.22,666.22,705.92,705.92,562.22,562.22,461.82,461.82,582.92,582.92,645.82,645.82,691.32,691.37,909.97,909.97,937.37,937.38,0028,0028,060.88,060.87,991.67,991.68,083.18,083.18,178.78,178.77,7707,7708,528.68,528.68,634.68,634.68,692.18,692.18,764.88,764.8FemaleMale201320142015201620172018201920202021202220232024
02,5005,0007,50010,00012,50015,000
Add this content to your personal favorites. These can be accessed from the favorites menu in the main navigation.
You have no right to use this feature.
Make sure to contact us if you are interested in scientific citation.
You can upgrade your account to enable this functionality for all statistics.
This feature is not available with your current account.Request access
Statista has been my savior on several occasions.
The site is easy to maneuver and the data is in a format that can
go right into a report or presentation.
Learn more about how Statista can support your business.
ILO. (December 14, 2022). Number of people employed in Morocco from 2013 to 2024, by gender (in 1,000s) [Graph]. In Statista. Retrieved February 03, 2025, from https://www.statista.com/statistics/1286233/number-of-employees-in-morocco-by-gender/
ILO. "Number of people employed in Morocco from 2013 to 2024, by gender (in 1,000s)." Chart. December 14, 2022. Statista. Accessed February 03, 2025. https://www.statista.com/statistics/1286233/number-of-employees-in-morocco-by-gender/
ILO. (2022). Number of people employed in Morocco from 2013 to 2024, by gender (in 1,000s). Statista. Statista Inc.. Accessed: February 03, 2025. https://www.statista.com/statistics/1286233/number-of-employees-in-morocco-by-gender/
ILO. "Number of People Employed in Morocco from 2013 to 2024, by Gender (in 1,000s)." Statista, Statista Inc., 14 Dec 2022, https://www.statista.com/statistics/1286233/number-of-employees-in-morocco-by-gender/
ILO, Number of people employed in Morocco from 2013 to 2024, by gender (in 1,000s) Statista, https://www.statista.com/statistics/1286233/number-of-employees-in-morocco-by-gender/ (last visited February 03, 2025)
Number of people employed in Morocco from 2013 to 2024, by gender (in 1,000s) [Graph], ILO, December 14, 2022. [Online]. Available: https://www.statista.com/statistics/1286233/number-of-employees-in-morocco-by-gender/
Profit from additional features with an Employee Account
Please create an employee account to be able to mark statistics as favorites.
Then you can access your favorite statistics via the star in the header.
Profit from the additional features of your individual account
Currently, you are using a shared account. To use individual functions (e.g., mark statistics as favourites, set
statistic alerts) please log in with your personal account.
If you are an admin, please authenticate by logging in again.