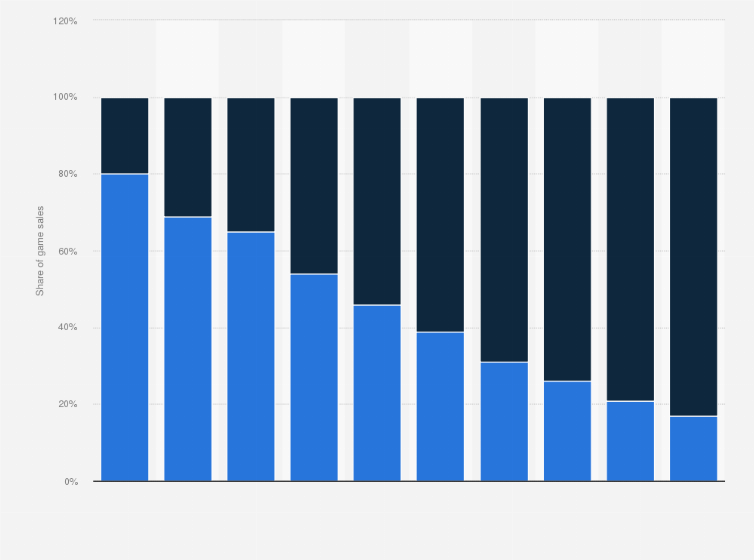
Digital and physical game sales in the U.S. 2009-2018, by format
Published by
In today’s increasingly digital world where information can be accessed in seconds, gamers do not want to waste a second before getting their hands on the latest releases. In 2018, a record 83 percent of all computer and video games were sold in digital form, meaning that, once the game is downloaded, it is immediately ready to play. In contrast, only 17 percent of video games were sold in physical form. This is a dramatic turnaround from less than a decade earlier, when 80 percent of video games were sold as physical copies.
Digital gamers
The digital gaming industry is a continually growing market. The number of gamers playing downloaded games in the United States is expected to grow from 170 million in 2017 to 174.4 million in 2023, and similar growth is expected for mobile and online games. In the same timeframe, the revenue generated from downloaded games is due to increase from just under four billion U.S. dollars to over 4.3 billion U.S. dollars.
Downloadable content
A big draw of the digital gaming market is the ability to download extra content for games and other apps at the push of a button. This DLC market was valued at 5.3 billion U.S. dollars in 2011, but is expected to almost quadruple to 19.5 billion U.S. dollars by 2020. While gamers worldwide unsurprisingly spend the most amount of money on full download games, the average amount spent on in-game downloads is almost as high. Some of the leading reasons for spending hard-earned cash on in-game purchases and downloadable content include being able to buy things that give the gamer an advantage in the game and the ability to level up more quickly.