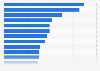
Average weekly Instagram brand posts 2023, by vertical

Average number of weekly brand posts on Instagram in 2023, by vertical

CharacteristicNumber of Instagram posts per week
Sports teams 18
Media 12.2
Health & beauty 6.8
Fashion 6.1
Retail 5.7
Home decor 4.9
Nonprofits 4.9
Total 4.7
Financial services 4
Higher ed 3.9
Influencers 3.8
Travel 3.8
Tech & software 3.7
Created with Highcharts 7.2.2Number of Instagram posts per week181812.212.26.86.86.16.15.75.74.94.94.94.94.74.7443.93.93.83.83.83.83.73.73.13.12.72.7Sports teamsMediaHealth & beautyFashionRetailHome decorNonprofitsTotalFinancial servicesHigher edInfluencersTravelTech & softwareAlcoholFood & beverage
01234567891011121314151617181920
Download
Show detailed source information?
Register for free
Already a member?
Log in
Source

Use Ask Statista Research Service

Release date

February 2024

Region

Worldwide

Survey time period

2023

Supplementary notes

According to the source: "we provide a representative sample of organic and paid posts from national and international companies in each industry by selecting 150 companies at random from each industry in our database of over 200,000 companies. Companies selected had active presences on Facebook, Instagram, and Twitter as of January 2023, and had Facebook fan counts between 25,000 and 1,000,000 and minimum Instagram and Twitter followers of 1,000 as of the same date."

Citation formats
Access all statistics starting from $2,388 USD yearly *

* For commercial use only

Basic Account

For single users
$0 USD
Always free
Access limited to Free Statistics. Premium Statistics are not included.
  • Free Statistics
Based on your interests

Starter Account

For single users
$199 USD
per month, billed annually 1
  • Free Statistics
  • Premium Statistics

Professional Account

For teams of up to 5 people
$1,299 USD
per month, billed annually 1
  • Free + Premium Statistics
  • Reports
  • Market Insights

1 All prices do not include sales tax. The account requires an annual contract and will renew after one year to the regular list price.

Leading companies trust Statista:
paypal google adobe pg samsung telekom

Related reports: Available to download in PDF or PPTX format

All datain one format
All data
in one format
Influencer marketing worldwide

Everything on "Influencer marketing worldwide" in one document: edited and divided into chapters, including detailed references.

I think of Statista as Google for researchers. Statista provides you with the information you search for right away.
Dr. Horst Stipp

Dr. Horst Stipp
EVP, Research & Innovation, Advertising Research Foundation

Statistics on " Instagram advertising and marketing "

Other statistics that may interest you Instagram advertising and marketing

Overview

4

Competitors

4

Usage

5

Metrics

5

Successful brands

3

Influencers

6

Audience

6

Further related statistics

16

Discover Statista

Need help with using Statista for your research? Tutorials and first steps
Do you have any questions about our business solutions?

We provide you with detailed information about our Professional Account.

All features, all contents, at all times: Learn more about our professional solutions.

* For commercial use only

Basic Account

For single users
$0 USD
Always free
Access limited to Free Statistics. Premium Statistics are not included.
  • Free Statistics
Based on your interests

Starter Account

For single users
$199 USD
per month, billed annually 1
  • Free Statistics
  • Premium Statistics

Professional Account

For teams of up to 5 people
$1,299 USD
per month, billed annually 1
  • Free + Premium Statistics
  • Reports
  • Market Insights

1 All prices do not include sales tax. The account requires an annual contract and will renew after one year to the regular list price.

Learn more about how Statista can support your business.