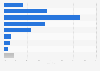
Emergency room visit rates in the U.S. in 2023, by state
Emergency room visit rates across the United States show significant variation, with a national average of 422 visits per 1,000 population in 2023. This average masks considerable differences between states, ranging from 596 visits per 1,000 population in West Virginia to just 226 in Nevada.
Wait times in emergency rooms
While ER visit rates provide insight into utilization, wait times offer a glimpse into the efficiency of emergency care delivery. In 2022, ER patients waited an average of 38.1 minutes to see a healthcare provider in emergency departments nationwide. Interestingly, the COVID-19 pandemic temporarily reduced wait times in 2020, but they rebounded to pre-pandemic levels by 2021. Most patients, roughly 70 percent, spend less than an hour in the emergency department before being seen by a medical professional. These figures suggest that despite high utilization in some areas, many emergency departments manage to process patients relatively quickly.
Demographic disparities in emergency care
Emergency department usage varies significantly across different demographic groups, revealing important healthcare access disparities. Infants under one-year-old and adults 75 years and over have the highest ED visit rates among all age groups. Additionally, racial disparities in ED rates are evident, with non-Hispanic Black individuals having double the ED visit rate of non-Hispanic White individuals. These patterns underscore the need for targeted healthcare interventions and improved access to acute care for vulnerable populations.