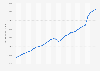
In fiscal year 2022, retailers in the United States reported, on average, an inventory shrink of 1.6 percent. This was a slight increase compared to the previous year and in line with the rates measured in 2020 and 2019. That year, the median inventory shrinkage rate among U.S. retailers came to 1.4 percent.
Inventory shrinkage, which is measured as retail sales loss, is typically caused by internal and external theft, process mistakes, as well as systemic errors.
Average inventory shrinkage rate among retailers in the United States in the fiscal years of 2016 to 2022
Adjust the presentation of the statistic and data points.
Share the statistic on social media channels or embed the statistic in your
website using "Embed Code", where available.
Cite this statistic and select one of the following formats: APA, Chicago, Harvard, MLA & Bluebook.
Print the statistic including description and metadata.
Chart type
Average inventory shrinkage rate among retailers in the United States in the fiscal years of 2016 to 2022
Share this statistic
You have no right to use this feature.
Make sure to contact us if you are interested in scientific citation.
You can upgrade your account to enable this functionality for all statistics.
This feature is not available with your current account.Request access
Learn more about how Statista can support your business.
National Retail Federation. (September 26, 2023). Average inventory shrinkage rate among retailers in the United States in the fiscal years of 2016 to 2022 [Graph]. In Statista. Retrieved April 02, 2025, from https://www.statista.com/statistics/1456367/average-retailers-inventory-shrinkage-rate-us/
National Retail Federation. "Average inventory shrinkage rate among retailers in the United States in the fiscal years of 2016 to 2022." Chart. September 26, 2023. Statista. Accessed April 02, 2025. https://www.statista.com/statistics/1456367/average-retailers-inventory-shrinkage-rate-us/
National Retail Federation. (2023). Average inventory shrinkage rate among retailers in the United States in the fiscal years of 2016 to 2022. Statista. Statista Inc.. Accessed: April 02, 2025. https://www.statista.com/statistics/1456367/average-retailers-inventory-shrinkage-rate-us/
National Retail Federation. "Average Inventory Shrinkage Rate among Retailers in The United States in The Fiscal Years of 2016 to 2022." Statista, Statista Inc., 26 Sep 2023, https://www.statista.com/statistics/1456367/average-retailers-inventory-shrinkage-rate-us/
National Retail Federation, Average inventory shrinkage rate among retailers in the United States in the fiscal years of 2016 to 2022 Statista, https://www.statista.com/statistics/1456367/average-retailers-inventory-shrinkage-rate-us/ (last visited April 02, 2025)
Average inventory shrinkage rate among retailers in the United States in the fiscal years of 2016 to 2022 [Graph], National Retail Federation, September 26, 2023. [Online]. Available: https://www.statista.com/statistics/1456367/average-retailers-inventory-shrinkage-rate-us/
Profit from additional features with an Employee Account
Please create an employee account to be able to mark statistics as favorites.
Then you can access your favorite statistics via the star in the header.
Profit from the additional features of your individual account
Currently, you are using a shared account. To use individual functions (e.g., mark statistics as favourites, set
statistic alerts) please log in with your personal account.
If you are an admin, please authenticate by logging in again.