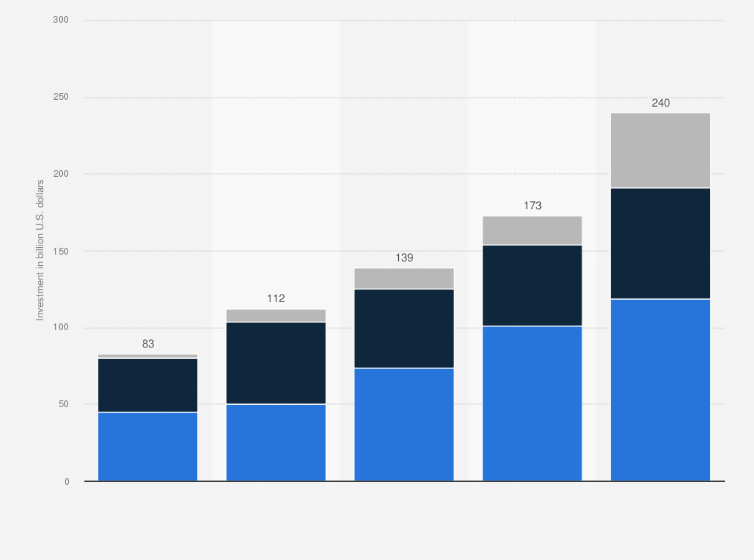
Public and private investment in IRA-eligible clean technology in the United States totaled 240 billion U.S. dollars in 2023, a 73 percent increase from 2021. The energy and industry segment recieved half the investment in 2023, at 119 billion U.S. dollar. Meanwhile, annual investment in the manufacture of greenhouse gas emission-reducing technologies more than tripled between 2021 and 2023, to roughly 50 billion U.S. dollars.
Annual public and private clean investment in the United States from 2019 to 2023, by segment
(in billion U.S. dollars)
Adjust the presentation of the statistic and data points.
Share the statistic on social media channels or embed the statistic in your
website using "Embed Code", where available.
Cite this statistic and select one of the following formats: APA, Chicago, Harvard, MLA & Bluebook.
Print the statistic including description and metadata.
Chart type
Annual public and private clean investment in the United States from 2019 to 2023, by segment
Share this statistic
You have no right to use this feature.
Make sure to contact us if you are interested in scientific citation.
You can upgrade your account to enable this functionality for all statistics.
This feature is not available with your current account.Request access
For this statistic, clean investment is split into three segments: Manufacturing - investment in the manufacture of GHG emission-reducing technology. Energy and Industry - investment in the deployment of that technology, both to produce clean energy or decarbonize industrial production. Retail - the purchase and installation of that technology by individual households and businesses.
Learn more about how Statista can support your business.
Silicon Valley Bank. (May 21, 2024). Annual public and private clean investment in the United States from 2019 to 2023, by segment (in billion U.S. dollars) [Graph]. In Statista. Retrieved May 09, 2025, from https://www.statista.com/statistics/1452704/clean-investment-in-the-us-by-segment/
Silicon Valley Bank. "Annual public and private clean investment in the United States from 2019 to 2023, by segment (in billion U.S. dollars)." Chart. May 21, 2024. Statista. Accessed May 09, 2025. https://www.statista.com/statistics/1452704/clean-investment-in-the-us-by-segment/
Silicon Valley Bank. (2024). Annual public and private clean investment in the United States from 2019 to 2023, by segment (in billion U.S. dollars). Statista. Statista Inc.. Accessed: May 09, 2025. https://www.statista.com/statistics/1452704/clean-investment-in-the-us-by-segment/
Silicon Valley Bank. "Annual Public and Private Clean Investment in The United States from 2019 to 2023, by Segment (in Billion U.S. Dollars)." Statista, Statista Inc., 21 May 2024, https://www.statista.com/statistics/1452704/clean-investment-in-the-us-by-segment/
Silicon Valley Bank, Annual public and private clean investment in the United States from 2019 to 2023, by segment (in billion U.S. dollars) Statista, https://www.statista.com/statistics/1452704/clean-investment-in-the-us-by-segment/ (last visited May 09, 2025)
Annual public and private clean investment in the United States from 2019 to 2023, by segment (in billion U.S. dollars) [Graph], Silicon Valley Bank, May 21, 2024. [Online]. Available: https://www.statista.com/statistics/1452704/clean-investment-in-the-us-by-segment/
Profit from additional features with an Employee Account
Please create an employee account to be able to mark statistics as favorites.
Then you can access your favorite statistics via the star in the header.
Profit from the additional features of your individual account
Currently, you are using a shared account. To use individual functions (e.g., mark statistics as favourites, set
statistic alerts) please log in with your personal account.
If you are an admin, please authenticate by logging in again.