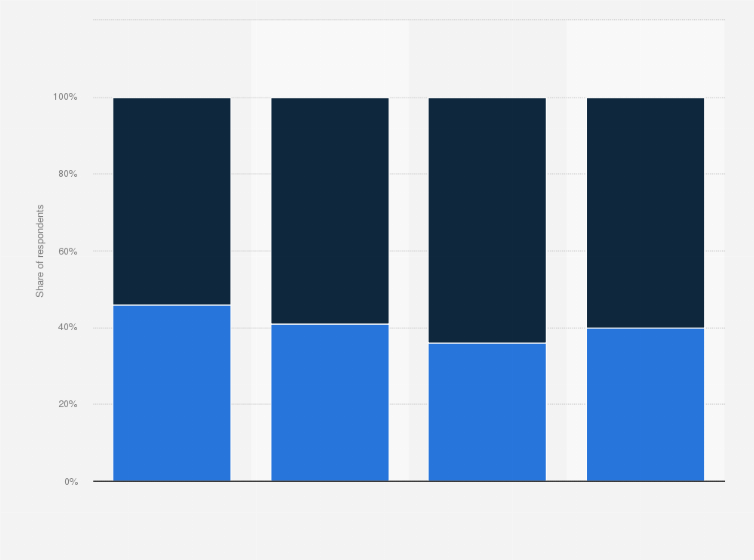
Consumers watching favorite new or older shows in the U.S. 2021-2024

Log in or register to access precise data.

Distribution of consumers watching favorite new and older shows in the United States from 2021 to 2024

CharacteristicNew show: first season in past yearOlder show: it's been on several years
- - -
- - -
- - -
- - -
Statistic: Distribution of consumers watching favorite new and older shows in the United States from 2021 to 2024
Download
Show detailed source information?
Register for free
Already a member?
Log in
Sources

Use Ask Statista Research Service

Release date

November 2024

Region

United States

Survey time period

2021 to 2024

Number of respondents

1,602*

Age group

16-74 years

Special properties

consumers with broadband watching at least 1 hour of TV per week, among those who discovered a new favorite show in the past year

Supplementary notes

*Number of respondents from October 2024.

The question was phrased by the source as follows: “Which best describes the favorite show you've started watching?”

Citation formats
Access all statistics starting from $2,388 USD yearly *

* For commercial use only

Basic Account

For single users
$0 USD
Always free
Access limited to Free Statistics. Premium Statistics are not included.
  • Free Statistics
Based on your interests

Starter Account

For single users
$199 USD
per month, billed annually 1
  • Free Statistics
  • Premium Statistics
  • The statistic on this page is a Premium Statistic and is included in this account.

Professional Account

For teams of up to 5 people
$1,299 USD
per month, billed annually 1
  • Free + Premium Statistics
  • Reports
  • Market Insights

1 All prices do not include sales tax. The account requires an annual contract and will renew after one year to the regular list price.

Leading companies trust Statista:
paypal google adobe pg samsung telekom

Related reports: Available to download in PDF or PPTX format

All datain one format
All data
in one format
Video streaming experience and preferences in the United States

Everything on "Video streaming experience and preferences in the United States" in one document: edited and divided into chapters, including detailed references.

Statista is a great source of knowledge, and pretty helpful to manage the daily work.
Christof Baron

Christof Baron
CEO, MindShare Germany

Statistics on " Video streaming experience and preferences in the United States "

Other statistics that may interest you Video streaming experience and preferences in the United States

Overview

5

Streaming features and reasons

5

Content discovery

7

Lean-back experience and binge-viewing

5

Popular devices and second-screen activities

6

Bundles and gamification

5

Live streaming

3

Socializing

6

Short-form content

4

Discover Statista

Need help with using Statista for your research? Tutorials and first steps
Do you have any questions about our business solutions?

We provide you with detailed information about our Professional Account.

Access all statistics starting from $2,388 USD yearly *

* For commercial use only

Basic Account

For single users
$0 USD
Always free
Access limited to Free Statistics. Premium Statistics are not included.
  • Free Statistics
Based on your interests

Starter Account

For single users
$199 USD
per month, billed annually 1
  • Free Statistics
  • Premium Statistics
  • The statistic on this page is a Premium Statistic and is included in this account.

Professional Account

For teams of up to 5 people
$1,299 USD
per month, billed annually 1
  • Free + Premium Statistics
  • Reports
  • Market Insights

1 All prices do not include sales tax. The account requires an annual contract and will renew after one year to the regular list price.

Learn more about how Statista can support your business.