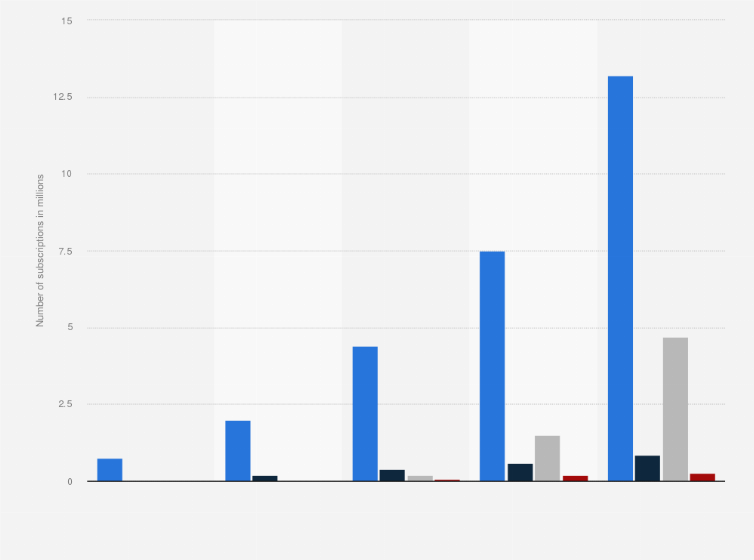
Commercial-based cross-border payments in Asia-Pacific outpaced the consumer transactions between 2021 and 2022. Asia-Pacific has the highest value of cross-border payments in total, although the United States-Mexico corridor is the biggest overall. The source adds that the highest global growth after 2022 is expected in C2B cross-border, due to increasing online shopping and international travel. Consumer categories, it continues, also have higher margins when compared to B2B.
Total cross-border payments revenue – B2B, B2C, C2B, remittances – in Asia-Pacific (APAC) from 2014 to 2022
(in billion U.S. dollars)
Characteristic
Cross-border payment services (B2B, B2C) and documentary trade finance
C2C remittance services and C2B cross-border payment services
-
-
-
-
-
-
-
-
-
-
-
-
-
-
-
-
-
-
-
-
-
-
-
-
-
-
-
Exclusive Premium Statistic
To access all Premium Statistics, you need a paid Statista Account
All figures provided are estimates, and have been taken from different reports
Supplementary notes
The source did not separate between countries – it only provided regional numbers for North America as a whole. The source does not clarify whether it places Mexico under North America or under Latin America. It also did not provide more in-depth figures on the exact type of cross-border payments or remittances, such as what goods or services are exactly paid for.
Profit from the additional features of your individual account
Currently, you are using a shared account. To use individual functions (e.g., mark statistics as favourites, set
statistic alerts) please log in with your personal account.
If you are an admin, please authenticate by logging in again.
Learn more about how Statista can support your business.
Statista, & McKinsey & Company. (September 18, 2023). Total cross-border payments revenue – B2B, B2C, C2B, remittances – in Asia-Pacific (APAC) from 2014 to 2022 (in billion U.S. dollars) [Graph]. In Statista. Retrieved July 22, 2024, from https://www.statista.com/statistics/1422589/north-america-cross-border-payments-by-channel/
Statista, und McKinsey & Company. "Total cross-border payments revenue – B2B, B2C, C2B, remittances – in Asia-Pacific (APAC) from 2014 to 2022 (in billion U.S. dollars)." Chart. September 18, 2023. Statista. Accessed July 22, 2024. https://www.statista.com/statistics/1422589/north-america-cross-border-payments-by-channel/
Statista, McKinsey & Company. (2023). Total cross-border payments revenue – B2B, B2C, C2B, remittances – in Asia-Pacific (APAC) from 2014 to 2022 (in billion U.S. dollars). Statista. Statista Inc.. Accessed: July 22, 2024. https://www.statista.com/statistics/1422589/north-america-cross-border-payments-by-channel/
Statista, and McKinsey & Company. "Total Cross-border Payments Revenue – B2b, B2c, C2b, Remittances – in Asia-pacific (Apac) from 2014 to 2022 (in Billion U.S. Dollars)." Statista, Statista Inc., 18 Sep 2023, https://www.statista.com/statistics/1422589/north-america-cross-border-payments-by-channel/
Statista & McKinsey & Company, Total cross-border payments revenue – B2B, B2C, C2B, remittances – in Asia-Pacific (APAC) from 2014 to 2022 (in billion U.S. dollars) Statista, https://www.statista.com/statistics/1422589/north-america-cross-border-payments-by-channel/ (last visited July 22, 2024)
Total cross-border payments revenue – B2B, B2C, C2B, remittances – in Asia-Pacific (APAC) from 2014 to 2022 (in billion U.S. dollars) [Graph], Statista, & McKinsey & Company, September 18, 2023. [Online]. Available: https://www.statista.com/statistics/1422589/north-america-cross-border-payments-by-channel/