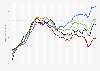
In the most recently reported period, many non-food consumer product categories saw price changes compared to the corresponding period a year earlier in the Netherlands. In February 2024, household textile prices declined by four and a half percent in this country.
Annual price inflation change of non-food products in Netherlands monthly from January 2022 to February 2024, by product category
(as a percentage)
Characteristic
Clothing
Footwear
Furniture and furnishings, carpets and other floor coverings
Profit from the additional features of your individual account
Currently, you are using a shared account. To use individual functions (e.g., mark statistics as favourites, set
statistic alerts) please log in with your personal account.
If you are an admin, please authenticate by logging in again.
Learn more about how Statista can support your business.
Eurostat. (March 18, 2024). Annual price inflation change of non-food products in Netherlands monthly from January 2022 to February 2024, by product category (as a percentage) [Graph]. In Statista. Retrieved December 21, 2024, from https://www.statista.com/statistics/1413195/price-inflation-nonfood-netherlands/
Eurostat. "Annual price inflation change of non-food products in Netherlands monthly from January 2022 to February 2024, by product category (as a percentage)." Chart. March 18, 2024. Statista. Accessed December 21, 2024. https://www.statista.com/statistics/1413195/price-inflation-nonfood-netherlands/
Eurostat. (2024). Annual price inflation change of non-food products in Netherlands monthly from January 2022 to February 2024, by product category (as a percentage). Statista. Statista Inc.. Accessed: December 21, 2024. https://www.statista.com/statistics/1413195/price-inflation-nonfood-netherlands/
Eurostat. "Annual Price Inflation Change of Non-food Products in Netherlands Monthly from January 2022 to February 2024, by Product Category (as a Percentage)." Statista, Statista Inc., 18 Mar 2024, https://www.statista.com/statistics/1413195/price-inflation-nonfood-netherlands/
Eurostat, Annual price inflation change of non-food products in Netherlands monthly from January 2022 to February 2024, by product category (as a percentage) Statista, https://www.statista.com/statistics/1413195/price-inflation-nonfood-netherlands/ (last visited December 21, 2024)
Annual price inflation change of non-food products in Netherlands monthly from January 2022 to February 2024, by product category (as a percentage) [Graph], Eurostat, March 18, 2024. [Online]. Available: https://www.statista.com/statistics/1413195/price-inflation-nonfood-netherlands/