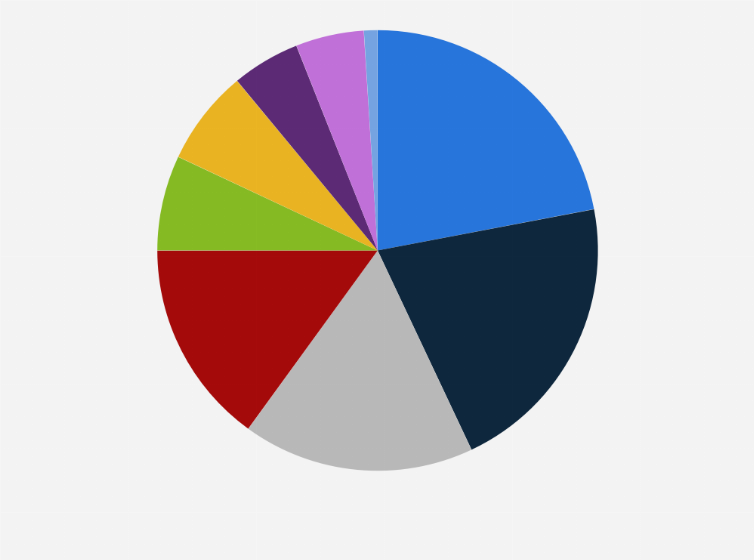
More than 430 million metric tons of carbon dioxide could be captured every year by 2030 if all likely CCS projects announced come to fruition. Approximately 22 percent of this capture capacity would come from the production of low-emissions hydrogen and ammonia, while another 21 percent would come from power and heat generation.
Projected distribution of carbon capture capacity worldwide in 2030, by application
Adjust the presentation of the statistic and data points.
Share the statistic on social media channels or embed the statistic in your
website using "Embed Code", where available.
Cite this statistic and select one of the following formats: APA, Chicago, Harvard, MLA & Bluebook.
Print the statistic including description and metadata.
Chart type
Projected distribution of carbon capture capacity worldwide in 2030, by application
Share this statistic
You have no right to use this feature.
Make sure to contact us if you are interested in scientific citation.
You can upgrade your account to enable this functionality for all statistics.
This feature is not available with your current account.Request access
Includes large-scale projects with a capture capacity of more than 100 000 t per year (or 1 000 t per year for DAC). Capture projects for CO2 use are included as long as CO2 is used in fuels, chemicals, polymers, building materials, or for yield boosting. Within planned CCUS industrial hubs, only identified CO2 capture projects are included (not the full potential capture capacity of industrial hubs for which capture sources are not specified). Merchant hydrogen or ammonia excludes on-site hydrogen production in industry (included in other industry or other fuel transformation).
Learn more about how Statista can support your business.
IEA. (April 25, 2024). Projected distribution of carbon capture capacity worldwide in 2030, by application [Graph]. In Statista. Retrieved May 13, 2025, from https://www.statista.com/statistics/1411481/projected-worldwide-ccs-capacity-shares-by-co2-by-source/
IEA. "Projected distribution of carbon capture capacity worldwide in 2030, by application." Chart. April 25, 2024. Statista. Accessed May 13, 2025. https://www.statista.com/statistics/1411481/projected-worldwide-ccs-capacity-shares-by-co2-by-source/
IEA. (2024). Projected distribution of carbon capture capacity worldwide in 2030, by application. Statista. Statista Inc.. Accessed: May 13, 2025. https://www.statista.com/statistics/1411481/projected-worldwide-ccs-capacity-shares-by-co2-by-source/
IEA. "Projected Distribution of Carbon Capture Capacity Worldwide in 2030, by Application." Statista, Statista Inc., 25 Apr 2024, https://www.statista.com/statistics/1411481/projected-worldwide-ccs-capacity-shares-by-co2-by-source/
IEA, Projected distribution of carbon capture capacity worldwide in 2030, by application Statista, https://www.statista.com/statistics/1411481/projected-worldwide-ccs-capacity-shares-by-co2-by-source/ (last visited May 13, 2025)
Projected distribution of carbon capture capacity worldwide in 2030, by application [Graph], IEA, April 25, 2024. [Online]. Available: https://www.statista.com/statistics/1411481/projected-worldwide-ccs-capacity-shares-by-co2-by-source/
Profit from additional features with an Employee Account
Please create an employee account to be able to mark statistics as favorites.
Then you can access your favorite statistics via the star in the header.
Profit from the additional features of your individual account
Currently, you are using a shared account. To use individual functions (e.g., mark statistics as favourites, set
statistic alerts) please log in with your personal account.
If you are an admin, please authenticate by logging in again.