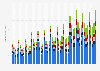
In 2022, the largest share of OTT subscription revenues worldwide was held by North American services, accounting for over 51 percent of total revenues. Asia Pacific and Western Europe followed with around 20 and 19 percent respectively. However, the revenue market share for North America is projected to drop below 50 percent beginning in 2024, marking a significant shift as it will be the first time the region loses its majority since the launch of Netflix's streaming platform in 2007.
Distribution of over-the-top (OTT) subscription revenues worldwide from 2020 to 2025, by region
Characteristic
North America
Asia Pacific
Western Europe
Central and South America
Central and Eastern Europe
Middle East and North Africa
2025*
49.2%
19.3%
19.8%
7.1%
3%
1.5%
2024*
49.8%
19.3%
19.7%
6.9%
2.9%
1.4%
2023*
50.4%
19.5%
19.5%
6.7%
2.7%
1.2%
2022
51.1%
20.2%
18.5%
6.5%
2.5%
1.1%
2021
50.6%
20.6%
19.3%
5.9%
2.5%
1%
2020
51.2%
21.2%
18.9%
5.6%
2.1%
1%
0%25%50%75%100%125%
Add this content to your personal favorites. These can be accessed from the favorites menu in the main navigation.
You have no right to use this feature.
Make sure to contact us if you are interested in scientific citation.
You can upgrade your account to enable this functionality for all statistics.
This feature is not available with your current account.Request access
Statista has been my savior on several occasions.
The site is easy to maneuver and the data is in a format that can
go right into a report or presentation.
Learn more about how Statista can support your business.
Ampere Analysis. (July 5, 2023). Distribution of over-the-top (OTT) subscription revenues worldwide from 2020 to 2025, by region [Graph]. In Statista. Retrieved March 02, 2025, from https://www.statista.com/statistics/1405348/ott-subscription-revenues-distribution-worldwide/
Ampere Analysis. "Distribution of over-the-top (OTT) subscription revenues worldwide from 2020 to 2025, by region ." Chart. July 5, 2023. Statista. Accessed March 02, 2025. https://www.statista.com/statistics/1405348/ott-subscription-revenues-distribution-worldwide/
Ampere Analysis. (2023). Distribution of over-the-top (OTT) subscription revenues worldwide from 2020 to 2025, by region . Statista. Statista Inc.. Accessed: March 02, 2025. https://www.statista.com/statistics/1405348/ott-subscription-revenues-distribution-worldwide/
Ampere Analysis. "Distribution of Over-the-top (Ott) Subscription Revenues Worldwide from 2020 to 2025, by Region ." Statista, Statista Inc., 5 Jul 2023, https://www.statista.com/statistics/1405348/ott-subscription-revenues-distribution-worldwide/
Ampere Analysis, Distribution of over-the-top (OTT) subscription revenues worldwide from 2020 to 2025, by region Statista, https://www.statista.com/statistics/1405348/ott-subscription-revenues-distribution-worldwide/ (last visited March 02, 2025)
Distribution of over-the-top (OTT) subscription revenues worldwide from 2020 to 2025, by region [Graph], Ampere Analysis, July 5, 2023. [Online]. Available: https://www.statista.com/statistics/1405348/ott-subscription-revenues-distribution-worldwide/
Profit from additional features with an Employee Account
Please create an employee account to be able to mark statistics as favorites.
Then you can access your favorite statistics via the star in the header.
Profit from the additional features of your individual account
Currently, you are using a shared account. To use individual functions (e.g., mark statistics as favourites, set
statistic alerts) please log in with your personal account.
If you are an admin, please authenticate by logging in again.