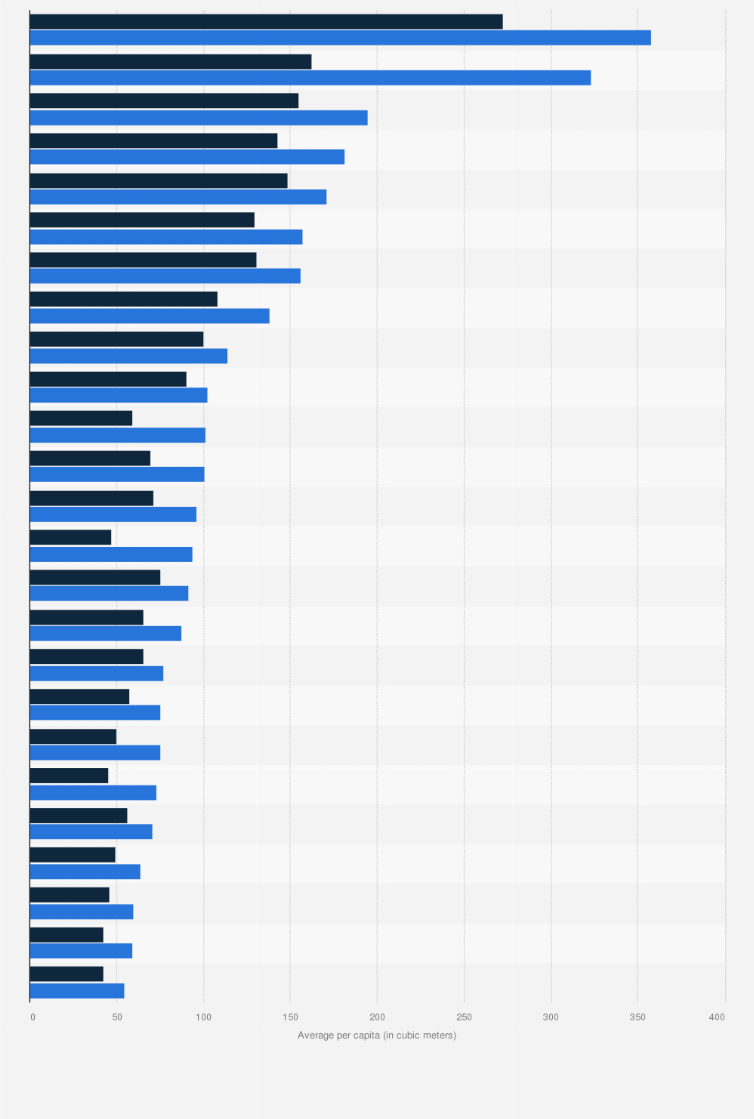
In 2021/2022, the Egyptian governorate of El Wadi El Gedid, also known as New Valley governorate, had the largest numbers of average per capita pure water produced and consumed, with values of 357.7 cubic meters, and 272.4 cubic meters, respectively. It is also to be noted that El Wadi El Gedid governorate is the largest governorate in Egypt by surface area. Egypt's capital, Cairo governorate, came in fourth.
Average per capita pure water produced and consumed in Egypt in 2021/2022, per governorate
(in cubic meters)
Canal cities are the governorates of Ismailia, Port Said, and Suez.
The source gives the following formula for calculating the average per capita of water produced:
The amount of pure water produced/ the estimated population of the year
**The source gives the following formula for calculating the average per capita of water consumed:
The amount of pure water consumed/ the estimated population of the year.
Profit from the additional features of your individual account
Currently, you are using a shared account. To use individual functions (e.g., mark statistics as favourites, set
statistic alerts) please log in with your personal account.
If you are an admin, please authenticate by logging in again.
Learn more about how Statista can support your business.
CAPMAS (Egypt). (June 30, 2023). Average per capita pure water produced and consumed in Egypt in 2021/2022, per governorate (in cubic meters) [Graph]. In Statista. Retrieved January 04, 2025, from https://www.statista.com/statistics/1399649/egypt-average-per-capita-water-consumed-produced-per-governorate/
CAPMAS (Egypt). "Average per capita pure water produced and consumed in Egypt in 2021/2022, per governorate (in cubic meters)." Chart. June 30, 2023. Statista. Accessed January 04, 2025. https://www.statista.com/statistics/1399649/egypt-average-per-capita-water-consumed-produced-per-governorate/
CAPMAS (Egypt). (2023). Average per capita pure water produced and consumed in Egypt in 2021/2022, per governorate (in cubic meters). Statista. Statista Inc.. Accessed: January 04, 2025. https://www.statista.com/statistics/1399649/egypt-average-per-capita-water-consumed-produced-per-governorate/
CAPMAS (Egypt). "Average per Capita Pure Water Produced and Consumed in Egypt in 2021/2022, per Governorate (in Cubic Meters)." Statista, Statista Inc., 30 Jun 2023, https://www.statista.com/statistics/1399649/egypt-average-per-capita-water-consumed-produced-per-governorate/
CAPMAS (Egypt), Average per capita pure water produced and consumed in Egypt in 2021/2022, per governorate (in cubic meters) Statista, https://www.statista.com/statistics/1399649/egypt-average-per-capita-water-consumed-produced-per-governorate/ (last visited January 04, 2025)
Average per capita pure water produced and consumed in Egypt in 2021/2022, per governorate (in cubic meters) [Graph], CAPMAS (Egypt), June 30, 2023. [Online]. Available: https://www.statista.com/statistics/1399649/egypt-average-per-capita-water-consumed-produced-per-governorate/