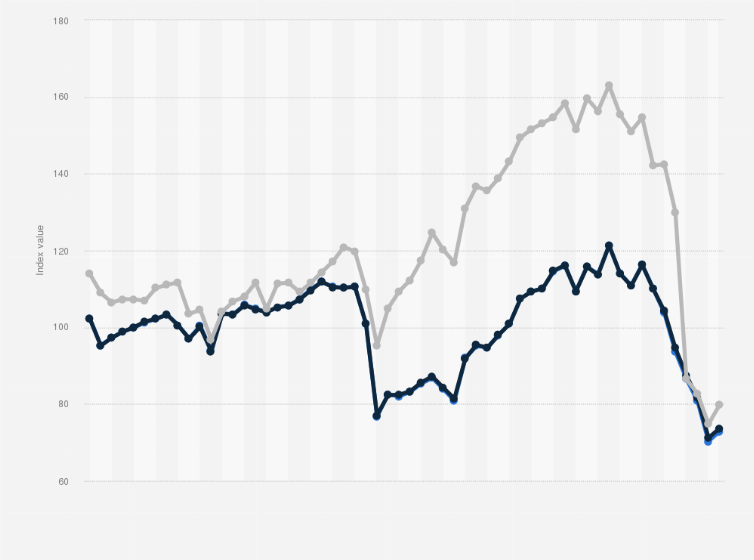
Both the Dow Jones Global ESG Select Real Estate Securities (RESI) and the Dow Jones Global Select RESI indices underperformed when compared to the S&P 1200 index as of October 2022. By design, the RESI indices aim to track the performance of direct real estate investment by including real estate investment trusts (REITs) and real estate operating companies (REOCs) traded worldwide. The Dow Jones Global Select ESG RESI includes the same constituents as the The Dow Jones Global Select RESI, but weights are adjusted for the environmental, social, and governance sustainability performance of the companies.
According to the figures, the ESG focus of the companies did not necessarily improve their price return index. While both indices followed similar trends, the Global Select RESI performed slightly better in May and June 2022, whereas S&P 1200 performed better in September and October 2022.
Price return of the Dow Jones Global Select ESG RESI and the Dow Jones Global Select Real Estate Securities compared to the S&P 1200 from January 2018 to October 2022
Adjust the presentation of the statistic and data points.
Share the statistic on social media channels or embed the statistic in your
website using "Embed Code", where available.
Cite this statistic and select one of the following formats: APA, Chicago, Harvard, MLA & Bluebook.
Print the statistic including description and metadata.
Chart type
Price return of the Dow Jones Global Select ESG RESI and the Dow Jones Global Select Real Estate Securities compared to the S&P 1200 from January 2018 to October 2022
Share this statistic
You have no right to use this feature.
Make sure to contact us if you are interested in scientific citation.
You can upgrade your account to enable this functionality for all statistics.
This feature is not available with your current account.Request access
The S&P Global 1200 captures 70 percent of the market cap of the global equity market. It is a composite of the following indices: S&P 500® (US), S&P Europe 350, S&P TOPIX 150 (Japan), S&P/TSX 60 (Canada), S&P/ASX All Australian 50, S&P Asia 50 and S&P Latin America 40.
Learn more about how Statista can support your business.
S&P Global. (November 24, 2022). Price return of the Dow Jones Global Select ESG RESI and the Dow Jones Global Select Real Estate Securities compared to the S&P 1200 from January 2018 to October 2022 [Graph]. In Statista. Retrieved May 10, 2025, from https://www.statista.com/statistics/1320716/dow-jones-esg-resi-index-development/
S&P Global. "Price return of the Dow Jones Global Select ESG RESI and the Dow Jones Global Select Real Estate Securities compared to the S&P 1200 from January 2018 to October 2022." Chart. November 24, 2022. Statista. Accessed May 10, 2025. https://www.statista.com/statistics/1320716/dow-jones-esg-resi-index-development/
S&P Global. (2022). Price return of the Dow Jones Global Select ESG RESI and the Dow Jones Global Select Real Estate Securities compared to the S&P 1200 from January 2018 to October 2022. Statista. Statista Inc.. Accessed: May 10, 2025. https://www.statista.com/statistics/1320716/dow-jones-esg-resi-index-development/
S&P Global. "Price Return of The Dow Jones Global Select Esg Resi and The Dow Jones Global Select Real Estate Securities Compared to The S&p 1200 from January 2018 to October 2022." Statista, Statista Inc., 24 Nov 2022, https://www.statista.com/statistics/1320716/dow-jones-esg-resi-index-development/
S&P Global, Price return of the Dow Jones Global Select ESG RESI and the Dow Jones Global Select Real Estate Securities compared to the S&P 1200 from January 2018 to October 2022 Statista, https://www.statista.com/statistics/1320716/dow-jones-esg-resi-index-development/ (last visited May 10, 2025)
Price return of the Dow Jones Global Select ESG RESI and the Dow Jones Global Select Real Estate Securities compared to the S&P 1200 from January 2018 to October 2022 [Graph], S&P Global, November 24, 2022. [Online]. Available: https://www.statista.com/statistics/1320716/dow-jones-esg-resi-index-development/
Profit from additional features with an Employee Account
Please create an employee account to be able to mark statistics as favorites.
Then you can access your favorite statistics via the star in the header.
Profit from the additional features of your individual account
Currently, you are using a shared account. To use individual functions (e.g., mark statistics as favourites, set
statistic alerts) please log in with your personal account.
If you are an admin, please authenticate by logging in again.