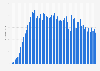
In 2022, the revenue of Samsung Group-affiliated companies accounted for about 22.4 percent of South Korea's gross domestic product (GDP). These affiliates generated total revenue of around 486.4 trillion South Korean won that year, having first surpassed the 400-trillion mark the previous year. Samsung’s share of revenue in GDP remained constant at around 20 percent during the surveyed period.
Samsung Group’s major affiliates
Samsung owns about 60 affiliates that are among the leading companies in their respective industries. For example, Samsung Electronics - best known for its Galaxy smartphones - is a global player in consumer electronics and telecommunications. Samsung Heavy Industries is one of the three leading companies in the domestic shipbuilding industry, while Samsung Group's affiliated financial companies, such as Samsung Fire & Marine Insurance and Samsung Life Insurance, have a strong influence on the South Korean financial market.
Samsung: The largest chaebol in South Korea
Samsung is the biggest chaebol group in South Korea – a large family-run conglomerate owned and managed by an individual or their family members. Chaebol groups typically have numerous affiliates, operate in multiple and diverse business sectors, and usually maintain a monopoly position in the relevant market. South Korea’s economy is dominated by a few chaebols, such as Samsung, SK, LG, and Hyundai Motor Company, whose influence on the market increased significantly, especially during the COVID-19 pandemic.
Revenue of Samsung Group as percentage of gross domestic product (GDP) in South Korea from 2017 to 2022
Profit from the additional features of your individual account
Currently, you are using a shared account. To use individual functions (e.g., mark statistics as favourites, set
statistic alerts) please log in with your personal account.
If you are an admin, please authenticate by logging in again.
Learn more about how Statista can support your business.
The Hankyoreh. (June 27, 2023). Revenue of Samsung Group as percentage of gross domestic product (GDP) in South Korea from 2017 to 2022 [Graph]. In Statista. Retrieved March 13, 2025, from https://www.statista.com/statistics/1314374/south-korea-samsung-groups-revenue-as-a-share-of-gdp/
The Hankyoreh. "Revenue of Samsung Group as percentage of gross domestic product (GDP) in South Korea from 2017 to 2022." Chart. June 27, 2023. Statista. Accessed March 13, 2025. https://www.statista.com/statistics/1314374/south-korea-samsung-groups-revenue-as-a-share-of-gdp/
The Hankyoreh. (2023). Revenue of Samsung Group as percentage of gross domestic product (GDP) in South Korea from 2017 to 2022. Statista. Statista Inc.. Accessed: March 13, 2025. https://www.statista.com/statistics/1314374/south-korea-samsung-groups-revenue-as-a-share-of-gdp/
The Hankyoreh. "Revenue of Samsung Group as Percentage of Gross Domestic Product (Gdp) in South Korea from 2017 to 2022." Statista, Statista Inc., 27 Jun 2023, https://www.statista.com/statistics/1314374/south-korea-samsung-groups-revenue-as-a-share-of-gdp/
The Hankyoreh, Revenue of Samsung Group as percentage of gross domestic product (GDP) in South Korea from 2017 to 2022 Statista, https://www.statista.com/statistics/1314374/south-korea-samsung-groups-revenue-as-a-share-of-gdp/ (last visited March 13, 2025)
Revenue of Samsung Group as percentage of gross domestic product (GDP) in South Korea from 2017 to 2022 [Graph], The Hankyoreh, June 27, 2023. [Online]. Available: https://www.statista.com/statistics/1314374/south-korea-samsung-groups-revenue-as-a-share-of-gdp/