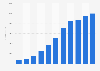
In 2021, Alibaba Group's net e-commerce sales amounted to an estimated 764 billion U.S. dollars globally. That figure is forecast to rise by more than 80 percent by 2026, reaching sales of nearly 1.4 trillion dollars.
E-commerce net sales of Alibaba Group from 2016 to 2026
(in billion U.S. dollars)
Profit from the additional features of your individual account
Currently, you are using a shared account. To use individual functions (e.g., mark statistics as favourites, set
statistic alerts) please log in with your personal account.
If you are an admin, please authenticate by logging in again.
Learn more about how Statista can support your business.
Edge by Ascential. (February 9, 2022). E-commerce net sales of Alibaba Group from 2016 to 2026 (in billion U.S. dollars) [Graph]. In Statista. Retrieved January 05, 2025, from https://www.statista.com/statistics/1295262/alibaba-ecommerce-sales-value/
Edge by Ascential. "E-commerce net sales of Alibaba Group from 2016 to 2026 (in billion U.S. dollars)." Chart. February 9, 2022. Statista. Accessed January 05, 2025. https://www.statista.com/statistics/1295262/alibaba-ecommerce-sales-value/
Edge by Ascential. (2022). E-commerce net sales of Alibaba Group from 2016 to 2026 (in billion U.S. dollars). Statista. Statista Inc.. Accessed: January 05, 2025. https://www.statista.com/statistics/1295262/alibaba-ecommerce-sales-value/
Edge by Ascential. "E-commerce Net Sales of Alibaba Group from 2016 to 2026 (in Billion U.S. Dollars)." Statista, Statista Inc., 9 Feb 2022, https://www.statista.com/statistics/1295262/alibaba-ecommerce-sales-value/
Edge by Ascential, E-commerce net sales of Alibaba Group from 2016 to 2026 (in billion U.S. dollars) Statista, https://www.statista.com/statistics/1295262/alibaba-ecommerce-sales-value/ (last visited January 05, 2025)
E-commerce net sales of Alibaba Group from 2016 to 2026 (in billion U.S. dollars) [Graph], Edge by Ascential, February 9, 2022. [Online]. Available: https://www.statista.com/statistics/1295262/alibaba-ecommerce-sales-value/