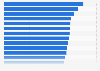
In 2023, 72.9 percent of internet users in Australia made a digital content purchase each month. In contrast, the share of internet users who make monthly digital content purchases in Japan stood at around 43.6 percent in 2023.
Share of internet users who made monthly digital content purchases in the Asia-Pacific region in 2023, by country or territory
Digital content includes online access to, downloads of, and subscriptions to a broad range of digital content, including movies, music, TV shows, streaming services, news services, e-books and magazines, video games, software, dating services, and digital gifts, as well as in-app purchases.
Profit from the additional features of your individual account
Currently, you are using a shared account. To use individual functions (e.g., mark statistics as favourites, set
statistic alerts) please log in with your personal account.
If you are an admin, please authenticate by logging in again.
Learn more about how Statista can support your business.
We Are Social, & DataReportal, & Meltwater. (February 22, 2024). Share of internet users who made monthly digital content purchases in the Asia-Pacific region in 2023, by country or territory [Graph]. In Statista. Retrieved December 19, 2024, from https://www.statista.com/statistics/1293350/apac-internet-users-who-made-monthly-digital-content-purchases-by-country/
We Are Social, und DataReportal, und Meltwater. "Share of internet users who made monthly digital content purchases in the Asia-Pacific region in 2023, by country or territory." Chart. February 22, 2024. Statista. Accessed December 19, 2024. https://www.statista.com/statistics/1293350/apac-internet-users-who-made-monthly-digital-content-purchases-by-country/
We Are Social, DataReportal, Meltwater. (2024). Share of internet users who made monthly digital content purchases in the Asia-Pacific region in 2023, by country or territory. Statista. Statista Inc.. Accessed: December 19, 2024. https://www.statista.com/statistics/1293350/apac-internet-users-who-made-monthly-digital-content-purchases-by-country/
We Are Social, and DataReportal, and Meltwater. "Share of Internet Users Who Made Monthly Digital Content Purchases in The Asia-pacific Region in 2023, by Country or Territory." Statista, Statista Inc., 22 Feb 2024, https://www.statista.com/statistics/1293350/apac-internet-users-who-made-monthly-digital-content-purchases-by-country/
We Are Social & DataReportal & Meltwater, Share of internet users who made monthly digital content purchases in the Asia-Pacific region in 2023, by country or territory Statista, https://www.statista.com/statistics/1293350/apac-internet-users-who-made-monthly-digital-content-purchases-by-country/ (last visited December 19, 2024)
Share of internet users who made monthly digital content purchases in the Asia-Pacific region in 2023, by country or territory [Graph], We Are Social, & DataReportal, & Meltwater, February 22, 2024. [Online]. Available: https://www.statista.com/statistics/1293350/apac-internet-users-who-made-monthly-digital-content-purchases-by-country/