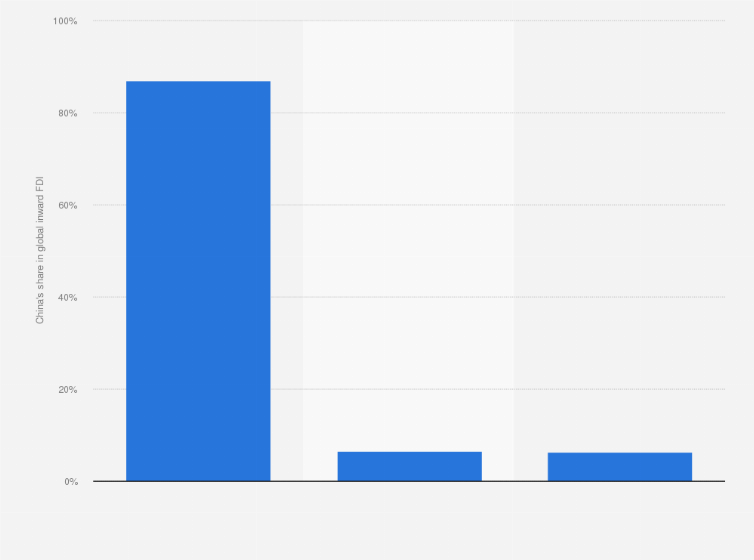
In 2023, approximately 87.1 percent of the actually used inward foreign direct investment (FDI) in China have been invested in Eastern China. Central and Western China attracted only a small fraction of total FDI inflows.
Distribution of annually utilized foreign direct investment (FDI) in China in 2023, by geographic region
Adjust the presentation of the statistic and data points.
Share the statistic on social media channels or embed the statistic in your
website using "Embed Code", where available.
Cite this statistic and select one of the following formats: APA, Chicago, Harvard, MLA & Bluebook.
Print the statistic including description and metadata.
Chart type
Distribution of annually utilized foreign direct investment (FDI) in China in 2023, by geographic region
Share this statistic
You have no right to use this feature.
Make sure to contact us if you are interested in scientific citation.
You can upgrade your account to enable this functionality for all statistics.
This feature is not available with your current account.Request access
Eastern China refers to Beijing, Tianjin, Hebei, Liaoning, Shanghai, Jiangsu, Zhejiang, Fujian, Shandong, Guangdong, and Hainan; Central China refers to Shanxi, Jilin, Heilongjiang, Anhui, Jiangxi, Henan, Hubei, and Hunan; Western China refers to Inner Mongolia, Guangxi, Chongqing, Sichuan, Guizhou, Yunnan, Tibet, Shaanxi, Gansu, Qinghai, Ningxia, and Xinjiang;
Citation formats
Access all statistics starting from $2,388 USD yearly
*
* For commercial use only
Basic Account
For single users
$0 USD
Always free
Access limited to Free Statistics. Premium Statistics are not included.
Learn more about how Statista can support your business.
MOFCOM China. (September 14, 2024). Distribution of annually utilized foreign direct investment (FDI) in China in 2023, by geographic region [Graph]. In Statista. Retrieved April 25, 2025, from https://www.statista.com/statistics/1288664/china-distribution-of-utilized-fdi-by-geographic-region/
MOFCOM China. "Distribution of annually utilized foreign direct investment (FDI) in China in 2023, by geographic region." Chart. September 14, 2024. Statista. Accessed April 25, 2025. https://www.statista.com/statistics/1288664/china-distribution-of-utilized-fdi-by-geographic-region/
MOFCOM China. (2024). Distribution of annually utilized foreign direct investment (FDI) in China in 2023, by geographic region. Statista. Statista Inc.. Accessed: April 25, 2025. https://www.statista.com/statistics/1288664/china-distribution-of-utilized-fdi-by-geographic-region/
MOFCOM China. "Distribution of Annually Utilized Foreign Direct Investment (Fdi) in China in 2023, by Geographic Region." Statista, Statista Inc., 14 Sep 2024, https://www.statista.com/statistics/1288664/china-distribution-of-utilized-fdi-by-geographic-region/
MOFCOM China, Distribution of annually utilized foreign direct investment (FDI) in China in 2023, by geographic region Statista, https://www.statista.com/statistics/1288664/china-distribution-of-utilized-fdi-by-geographic-region/ (last visited April 25, 2025)
Distribution of annually utilized foreign direct investment (FDI) in China in 2023, by geographic region [Graph], MOFCOM China, September 14, 2024. [Online]. Available: https://www.statista.com/statistics/1288664/china-distribution-of-utilized-fdi-by-geographic-region/
Profit from additional features with an Employee Account
Please create an employee account to be able to mark statistics as favorites.
Then you can access your favorite statistics via the star in the header.
Profit from the additional features of your individual account
Currently, you are using a shared account. To use individual functions (e.g., mark statistics as favourites, set
statistic alerts) please log in with your personal account.
If you are an admin, please authenticate by logging in again.