billion Japanese yen in net sales through its merchandising segment. The Japanese video game company develops and distributes a variety of merchandise based on its in-house intellectual properties (IPs), such as Final Fantasy and Nier.
Adjust the presentation of the statistic and data points.
Share the statistic on social media channels or embed the statistic in your
website using "Embed Code", where available.
Cite this statistic and select one of the following formats: APA, Chicago, Harvard, MLA & Bluebook.
Print the statistic including description and metadata.
Chart type
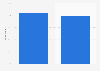
Net sales of the merchandising segment at Square Enix Holdings Co., Ltd. from fiscal year 2019 to 2024
Share this statistic
You have no right to use this feature.
Make sure to contact us if you are interested in scientific citation.
You can upgrade your account to enable this functionality for all statistics.
This feature is not available with your current account.Request access
fiscal years 2019 to 2024; the company's fiscal years ended March 31 of each stated year
Supplementary notes
Data prior to fiscal year 2022 come from previous reports. 100 Japanese yen equal 0.68 U.S. dollars or 0.62 euros as of September 2024. Values have been rounded.
Statista has been my savior on several occasions.
The site is easy to maneuver and the data is in a format that can
go right into a report or presentation.
Learn more about how Statista can support your business.
Square Enix. (May 13, 2024). Net sales of the merchandising segment at Square Enix Holdings Co., Ltd. from fiscal year 2019 to 2024 (in billion Japanese yen) [Graph]. In Statista. Retrieved August 25, 2025, from https://www.statista.com/statistics/1262749/square-enix-merchandising-net-sales/
Square Enix. "Net sales of the merchandising segment at Square Enix Holdings Co., Ltd. from fiscal year 2019 to 2024 (in billion Japanese yen)." Chart. May 13, 2024. Statista. Accessed August 25, 2025. https://www.statista.com/statistics/1262749/square-enix-merchandising-net-sales/
Square Enix. (2024). Net sales of the merchandising segment at Square Enix Holdings Co., Ltd. from fiscal year 2019 to 2024 (in billion Japanese yen). Statista. Statista Inc.. Accessed: August 25, 2025. https://www.statista.com/statistics/1262749/square-enix-merchandising-net-sales/
Square Enix. "Net Sales of The Merchandising Segment at Square Enix Holdings Co., Ltd. from Fiscal Year 2019 to 2024 (in Billion Japanese Yen)." Statista, Statista Inc., 13 May 2024, https://www.statista.com/statistics/1262749/square-enix-merchandising-net-sales/
Square Enix, Net sales of the merchandising segment at Square Enix Holdings Co., Ltd. from fiscal year 2019 to 2024 (in billion Japanese yen) Statista, https://www.statista.com/statistics/1262749/square-enix-merchandising-net-sales/ (last visited August 25, 2025)
Net sales of the merchandising segment at Square Enix Holdings Co., Ltd. from fiscal year 2019 to 2024 (in billion Japanese yen) [Graph], Square Enix, May 13, 2024. [Online]. Available: https://www.statista.com/statistics/1262749/square-enix-merchandising-net-sales/
Advertisement
Profit from additional features with an Employee Account
Please create an employee account to be able to mark statistics as favorites.
Then you can access your favorite statistics via the star in the header.
Profit from the additional features of your individual account
Currently, you are using a shared account. To use individual functions (e.g., mark statistics as favourites, set
statistic alerts) please log in with your personal account.
If you are an admin, please authenticate by logging in again.