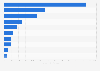
In 2019, the value of household consumption on interior products in Vietnam amounted to 38.6 trillion Vietnamese dong, making it the category with the highest consumption value. In 2024, interior products were forecasted to have a consumption value of 59.2 trillion Vietnamese dong among Vietnamese households.
Household goods consumption in Vietnam from 2018 to 2019 with forecasts until 2024, by category (in trillion Vietnamese dong)
Basic Account
Get to know the platform
You only have access to basic statistics.
This statistic is not included in your account.
Starter Account
The ideal entry-level account for individual users
- Instant access to 1m statistics
- Download in XLS, PDF & PNG format
- Detailed references
$199 USD / Month *
Professional Account
Full access
Business Solutions including all features.
* Prices do not include sales tax.
Other statistics that may interest you Church & Dwight
Market overview
6
- Premium Statistic Revenue of the home & laundry care industry worldwide 2019-2029
- Premium Statistic Revenue of the global household cleaners market from 2013 to 2026
- Premium Statistic Revenue of the household cleaners market worldwide by country 2023
- Premium Statistic Global beauty and personal care market value by category 2018 to 2028
- Premium Statistic Revenue of the oral care industry worldwide 2018-2028
- Premium Statistic Global electric toothbrush market value 2022-2027
Key figures of Church & Dwight
7
- Basic Statistic Net sales of Church & Dwight worldwide 2009-2023
- Premium Statistic Gross profit of Church & Dwight worldwide 2011-2023
- Basic Statistic Net income of Church & Dwight worldwide 2009-2023
- Premium Statistic Net sales share of Church & Dwight worldwide 2011-2023, by product segment
- Basic Statistic R&D expenditure of Church & Dwight worldwide 2009-2023
- Basic Statistic Marketing expenditure of Church & Dwight worldwide 2009-2023
- Basic Statistic Number of employees of Church & Dwight worldwide 2009-2023
Church & Dwight's impact on the market
8
- Premium Statistic Sales of the leading household/personal care companies worldwide 2022
- Basic Statistic Leading toothpaste vendors in the U.S. 2021, based on sales
- Premium Statistic Dollar sales of condom manufacturers in U.S. C-stores 2022
- Premium Statistic Unit sales of condom manufacturers in U.S. C-stores 2022
- Premium Statistic Leading liquid laundry detergent brands sales of the U.S. 2022
- Premium Statistic Unit sales of the leading liquid laundry detergent brands of the U.S. 2022
- Basic Statistic Sales of the leading unit dose laundry detergent brands in the U.S. 2022
- Basic Statistic Sales of the leading powder laundry detergent brands in the U.S. 2022
Competitors
8
- Premium Statistic Procter & Gamble's net sales worldwide 2012-2023
- Premium Statistic Net sales of Procter & Gamble in the U.S. 2014-2023
- Basic Statistic Unilever: revenue worldwide 2007-2023
- Premium Statistic Global brand value of Unilever from 2012 to 2021
- Premium Statistic Net revenue of Reckitt Benckiser worldwide 2017 to 2023, by category
- Premium Statistic Reckitt Benckiser's operating profit worldwide 2010-2023
- Premium Statistic Global net sales of The Clorox Company 2011-2023
- Premium Statistic Global gross profit of The Clorox Company 2011-2023
Further related statistics
6
- Net profit of Midea Group FY 2013-FY 2023
- Number of Hugo Boss stores worldwide in 2023, by region
- Hugo Boss - EBITDA 2005-2023
- LG Electronics revenue by segment 2016-2023, by quarter
- Electrical appliances retail sales volume index in Great Britain (UK) 2013-2023
- Number of Hugo Boss stores worldwide in 2020, by store type
Further Content: You might find this interesting as well
Statistics
- Net profit of Midea Group FY 2013-FY 2023
- Number of Hugo Boss stores worldwide in 2023, by region
- Hugo Boss - EBITDA 2005-2023
- LG Electronics revenue by segment 2016-2023, by quarter
- Electrical appliances retail sales volume index in Great Britain (UK) 2013-2023
- Number of Hugo Boss stores worldwide in 2020, by store type
Mirae Asset. (December 25, 2020). Household goods consumption in Vietnam from 2018 to 2019 with forecasts until 2024, by category (in trillion Vietnamese dong) [Graph]. In Statista. Retrieved June 11, 2024, from https://www.statista.com/statistics/1228405/vietnam-value-of-household-products-consumption/
Mirae Asset. "Household goods consumption in Vietnam from 2018 to 2019 with forecasts until 2024, by category (in trillion Vietnamese dong)." Chart. December 25, 2020. Statista. Accessed June 11, 2024. https://www.statista.com/statistics/1228405/vietnam-value-of-household-products-consumption/
Mirae Asset. (2020). Household goods consumption in Vietnam from 2018 to 2019 with forecasts until 2024, by category (in trillion Vietnamese dong). Statista. Statista Inc.. Accessed: June 11, 2024. https://www.statista.com/statistics/1228405/vietnam-value-of-household-products-consumption/
Mirae Asset. "Household Goods Consumption in Vietnam from 2018 to 2019 with Forecasts until 2024, by Category (in Trillion Vietnamese Dong)." Statista, Statista Inc., 25 Dec 2020, https://www.statista.com/statistics/1228405/vietnam-value-of-household-products-consumption/
Mirae Asset, Household goods consumption in Vietnam from 2018 to 2019 with forecasts until 2024, by category (in trillion Vietnamese dong) Statista, https://www.statista.com/statistics/1228405/vietnam-value-of-household-products-consumption/ (last visited June 11, 2024)
Household goods consumption in Vietnam from 2018 to 2019 with forecasts until 2024, by category (in trillion Vietnamese dong) [Graph], Mirae Asset, December 25, 2020. [Online]. Available: https://www.statista.com/statistics/1228405/vietnam-value-of-household-products-consumption/