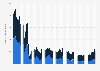
Baby boomers who use mobile savings apps in the United States 2020, by type

Share of baby boomers who use mobile savings apps when shopping in the United States as of June 2020, by type

CharacteristicShare of respondents
Grocery/drug/mass savings app 35%
Cash back/points app 12%
Coupon app 12%
In-store shopping rewards app 10%
Deal comparison app 6%
Shopping list app 5%
Created with Highcharts 7.2.2Share of respondents35%35%12%12%12%12%10%10%6%6%5%5%Grocery/drug/mass savings appCash back/points appCoupon appIn-store shopping rewards appDeal comparison appShopping list app
0%10%20%30%40%2.5%5%7.5%12.5%15%17.5%22.5%25%27.5%32.5%35%37.5%
Download
Show detailed source information?
Register for free
Already a member?
Log in
Source

Use Ask Statista Research Service

Release date

2020

Region

United States

Survey time period

June 2020

Number of respondents

1,000 respondents

Age group

18 years and older

Method of interview

Online panel

Supplementary notes

Figures refer to respondents who use such savings apps at least once a month or more often.
Baby boomer is defined by the source as being born between 1946 and 1964.

Citation formats
Access all statistics starting from $2,388 USD yearly *

* For commercial use only

Basic Account

For single users
$0 USD
Always free
Access limited to Free Statistics. Premium Statistics are not included.
  • Free Statistics
Based on your interests

Starter Account

For single users
$199 USD
per month, billed annually 1
  • Free Statistics
  • Premium Statistics

Professional Account

For teams of up to 5 people
$1,299 USD
per month, billed annually 1
  • Free + Premium Statistics
  • Reports
  • Market Insights

1 All prices do not include sales tax. The account requires an annual contract and will renew after one year to the regular list price.

Leading companies trust Statista:
paypal google adobe pg samsung telekom

Related reports: Available to download in PDF or PPTX format

All datain one format
All data
in one format
Coupon market in the United States

Everything on "Coupon market in the United States" in one document: edited and divided into chapters, including detailed references.

Statista is a great source of knowledge, and pretty helpful to manage the daily work.
Christof Baron

Christof Baron
CEO, MindShare Germany

Statistics on " Coupon market in the United States "

Other statistics that may interest you Coupon market in the United States

Overview

7

Digital coupons

8

Food coupons

7

Consumer behavior

8

Further related statistics

15

Discover Statista

Need help with using Statista for your research? Tutorials and first steps
Do you have any questions about our business solutions?

We provide you with detailed information about our Professional Account.

Access all statistics starting from $2,388 USD yearly *

* For commercial use only

Basic Account

For single users
$0 USD
Always free
Access limited to Free Statistics. Premium Statistics are not included.
  • Free Statistics
Based on your interests

Starter Account

For single users
$199 USD
per month, billed annually 1
  • Free Statistics
  • Premium Statistics

Professional Account

For teams of up to 5 people
$1,299 USD
per month, billed annually 1
  • Free + Premium Statistics
  • Reports
  • Market Insights

1 All prices do not include sales tax. The account requires an annual contract and will renew after one year to the regular list price.

Learn more about how Statista can support your business.