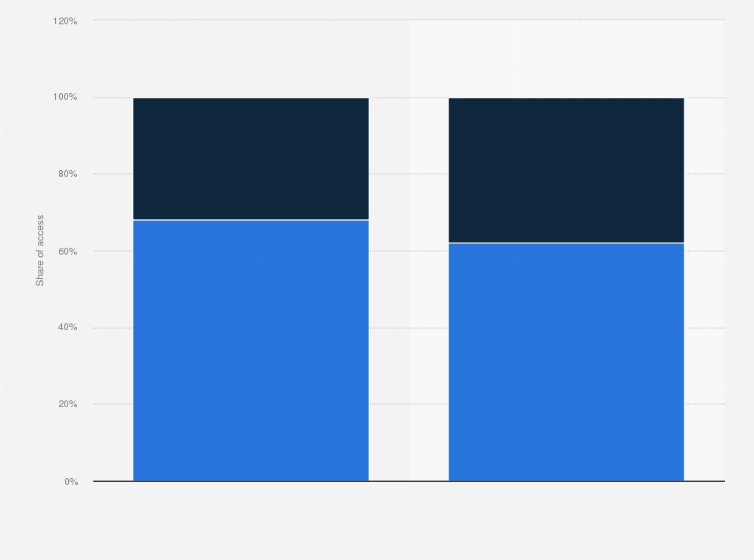
In May 2019, 62 percent of myGov account users logged in using a desktop computer compared to 38 percent who used a mobile device in Australia. When compared with the login rates in the same moth of the previous year, it appears that users are increasingly preferring to access their myGov account via a mobile device, although the majority of logins are still through a desktop computer.
Share of devices used to access myGov accounts in Australia in May 2018 and 2019, by device
Adjust the presentation of the statistic and data points.
Share the statistic on social media channels or embed the statistic in your
website using "Embed Code", where available.
Cite this statistic and select one of the following formats: APA, Chicago, Harvard, MLA & Bluebook.
Print the statistic including description and metadata.
Chart type
Share of devices used to access myGov accounts in Australia in May 2018 and 2019, by device
Share this statistic
You have no right to use this feature.
Make sure to contact us if you are interested in scientific citation.
You can upgrade your account to enable this functionality for all statistics.
This feature is not available with your current account.Request access
myGov services include:
Centrelink
Medicare
Australian Taxation Office
Child Support
Victorian Housing Register
My Health Record
National Disability Insurance Scheme
My Aged Care
Department of Veterans' Affairs (Australia) online facilities
Australian Job Search
Citation formats
Access all statistics starting from $2,388 USD yearly
*
* For commercial use only
Basic Account
For single users
$0 USD
Always free
Access limited to Free Statistics. Premium Statistics are not included.
Learn more about how Statista can support your business.
Digital Transformation Agency (Australia). (June 20, 2019). Share of devices used to access myGov accounts in Australia in May 2018 and 2019, by device [Graph]. In Statista. Retrieved April 25, 2025, from https://www.statista.com/statistics/1181520/australia-share-of-devices-used-to-access-mygov/
Digital Transformation Agency (Australia). "Share of devices used to access myGov accounts in Australia in May 2018 and 2019, by device ." Chart. June 20, 2019. Statista. Accessed April 25, 2025. https://www.statista.com/statistics/1181520/australia-share-of-devices-used-to-access-mygov/
Digital Transformation Agency (Australia). (2019). Share of devices used to access myGov accounts in Australia in May 2018 and 2019, by device . Statista. Statista Inc.. Accessed: April 25, 2025. https://www.statista.com/statistics/1181520/australia-share-of-devices-used-to-access-mygov/
Digital Transformation Agency (Australia). "Share of Devices Used to Access Mygov Accounts in Australia in May 2018 and 2019, by Device ." Statista, Statista Inc., 20 Jun 2019, https://www.statista.com/statistics/1181520/australia-share-of-devices-used-to-access-mygov/
Digital Transformation Agency (Australia), Share of devices used to access myGov accounts in Australia in May 2018 and 2019, by device Statista, https://www.statista.com/statistics/1181520/australia-share-of-devices-used-to-access-mygov/ (last visited April 25, 2025)
Share of devices used to access myGov accounts in Australia in May 2018 and 2019, by device [Graph], Digital Transformation Agency (Australia), June 20, 2019. [Online]. Available: https://www.statista.com/statistics/1181520/australia-share-of-devices-used-to-access-mygov/
Profit from additional features with an Employee Account
Please create an employee account to be able to mark statistics as favorites.
Then you can access your favorite statistics via the star in the header.
Profit from the additional features of your individual account
Currently, you are using a shared account. To use individual functions (e.g., mark statistics as favourites, set
statistic alerts) please log in with your personal account.
If you are an admin, please authenticate by logging in again.