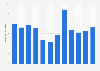
In 2019, the retail sales of non-alcoholic beverages in China amounted to around 991.4 billion yuan. Traditional sales channels, primarily grocery and convenience stores, accounted for around 44 percent of the retail sales generating nearly 437 billion yuan that year. The value of non-alcoholic beverage retail sales through traditional distribution channels was expected to exceed 498 billion yuan by 2024.
Retail sales value of non-alcoholic beverages in China in 2019 with a forecast for 2024, by sales channel type
(in billion yuan)
Characteristic
2019
2024*
-
-
-
-
-
-
-
-
-
-
-
-
-
-
-
Exclusive Premium Statistic
To access all Premium Statistics, you need a paid Statista Account
One yuan equals approximately 0.14 U.S. dollars and 0.13 euros (as of July 2020).
The types of sales channels were described by the source as follows:
Traditional channel primarily includes small grocery stores and non-chained
convenience stores. These stores are commonly owned and operated by individual entrepreneurs or households. Modern channel primarily includes shopping malls, supermarkets, and chained
convenience stores. Catering channel primarily refers to the catering service providers. E-commerce channel primarily refers to the online sales platforms. Other channels primarily include specialty channels and new retail channels
represented by vending machines. Specialty channels primarily include air transportation, train stations, gas stations and highway service areas.
Profit from the additional features of your individual account
Currently, you are using a shared account. To use individual functions (e.g., mark statistics as favourites, set
statistic alerts) please log in with your personal account.
If you are an admin, please authenticate by logging in again.
Learn more about how Statista can support your business.
HKExnews. (April 29, 2020). Retail sales value of non-alcoholic beverages in China in 2019 with a forecast for 2024, by sales channel type (in billion yuan) [Graph]. In Statista. Retrieved August 25, 2024, from https://www.statista.com/statistics/1136821/china-soft-beverage-retail-sales-by-sales-channel/
HKExnews. "Retail sales value of non-alcoholic beverages in China in 2019 with a forecast for 2024, by sales channel type (in billion yuan)." Chart. April 29, 2020. Statista. Accessed August 25, 2024. https://www.statista.com/statistics/1136821/china-soft-beverage-retail-sales-by-sales-channel/
HKExnews. (2020). Retail sales value of non-alcoholic beverages in China in 2019 with a forecast for 2024, by sales channel type (in billion yuan). Statista. Statista Inc.. Accessed: August 25, 2024. https://www.statista.com/statistics/1136821/china-soft-beverage-retail-sales-by-sales-channel/
HKExnews. "Retail Sales Value of Non-alcoholic Beverages in China in 2019 with a Forecast for 2024, by Sales Channel Type (in Billion Yuan)." Statista, Statista Inc., 29 Apr 2020, https://www.statista.com/statistics/1136821/china-soft-beverage-retail-sales-by-sales-channel/
HKExnews, Retail sales value of non-alcoholic beverages in China in 2019 with a forecast for 2024, by sales channel type (in billion yuan) Statista, https://www.statista.com/statistics/1136821/china-soft-beverage-retail-sales-by-sales-channel/ (last visited August 25, 2024)
Retail sales value of non-alcoholic beverages in China in 2019 with a forecast for 2024, by sales channel type (in billion yuan) [Graph], HKExnews, April 29, 2020. [Online]. Available: https://www.statista.com/statistics/1136821/china-soft-beverage-retail-sales-by-sales-channel/