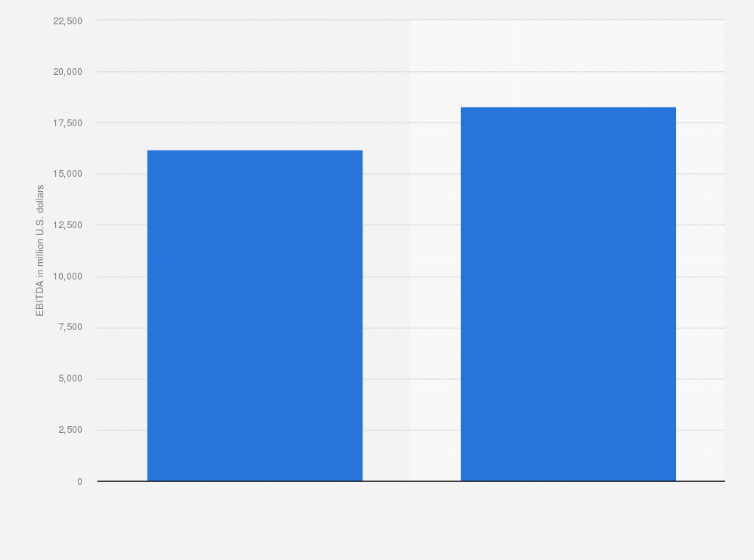
This statistic shows DowDuPont's pro forma operating EBITDA in 2017 and 2018. In 2018, DowDuPont's pro forma operating earnings before interest, taxes, depreciation, and amortization came to some
****
Log in or register to access precise data.
billion U.S. dollars.
In September 2017, the Dow Chemical Company and E. I. du Pont de Nemours and Company (DuPont) completed their merger, forming one of the largest chemical manufacturing companies in the world. In April 2019, the DowDuPont conglomerate separated into three companies: Dow, dedicated to commodity chemicals, DuPont, dedicated to specialty chemicals, and Corteva, dedicated to agricultural chemicals and seeds. DowDuPont was headquartered in Midland, Michigan.
Adjust the presentation of the statistic and data points.
Share the statistic on social media channels or embed the statistic in your
website using "Embed Code", where available.
Cite this statistic and select one of the following formats: APA, Chicago, Harvard, MLA & Bluebook.
Print the statistic including description and metadata.
Chart type
EBITDA of DowDuPont in 2017 and 2018 (in million U.S. dollars)*
Share this statistic
You have no right to use this feature.
Make sure to contact us if you are interested in scientific citation.
You can upgrade your account to enable this functionality for all statistics.
This feature is not available with your current account.Request access
* Pro forma Operating EBITDA (= earnings before interest, taxes, depreciation, and amortization).
This statistic is intended to provide historic information about the chemical conglomerate DowDuPont after the merger between Dow Chemical and DuPont was complete and before the conglomerate separated into three companies.
Statista has been my savior on several occasions.
The site is easy to maneuver and the data is in a format that can
go right into a report or presentation.
Learn more about how Statista can support your business.
Dow Chemical. (February 11, 2019). EBITDA of DowDuPont in 2017 and 2018 (in million U.S. dollars)* [Graph]. In Statista. Retrieved October 09, 2025, from https://www.statista.com/statistics/1107604/dowdupont-ebitda/
Dow Chemical. "EBITDA of DowDuPont in 2017 and 2018 (in million U.S. dollars)*." Chart. February 11, 2019. Statista. Accessed October 09, 2025. https://www.statista.com/statistics/1107604/dowdupont-ebitda/
Dow Chemical. (2019). EBITDA of DowDuPont in 2017 and 2018 (in million U.S. dollars)*. Statista. Statista Inc.. Accessed: October 09, 2025. https://www.statista.com/statistics/1107604/dowdupont-ebitda/
Dow Chemical. "Ebitda of Dowdupont in 2017 and 2018 (in Million U.S. Dollars)*." Statista, Statista Inc., 11 Feb 2019, https://www.statista.com/statistics/1107604/dowdupont-ebitda/
Dow Chemical, EBITDA of DowDuPont in 2017 and 2018 (in million U.S. dollars)* Statista, https://www.statista.com/statistics/1107604/dowdupont-ebitda/ (last visited October 09, 2025)
EBITDA of DowDuPont in 2017 and 2018 (in million U.S. dollars)* [Graph], Dow Chemical, February 11, 2019. [Online]. Available: https://www.statista.com/statistics/1107604/dowdupont-ebitda/
Advertisement
Profit from additional features with an Employee Account
Please create an employee account to be able to mark statistics as favorites.
Then you can access your favorite statistics via the star in the header.
Profit from the additional features of your individual account
Currently, you are using a shared account. To use individual functions (e.g., mark statistics as favourites, set
statistic alerts) please log in with your personal account.
If you are an admin, please authenticate by logging in again.