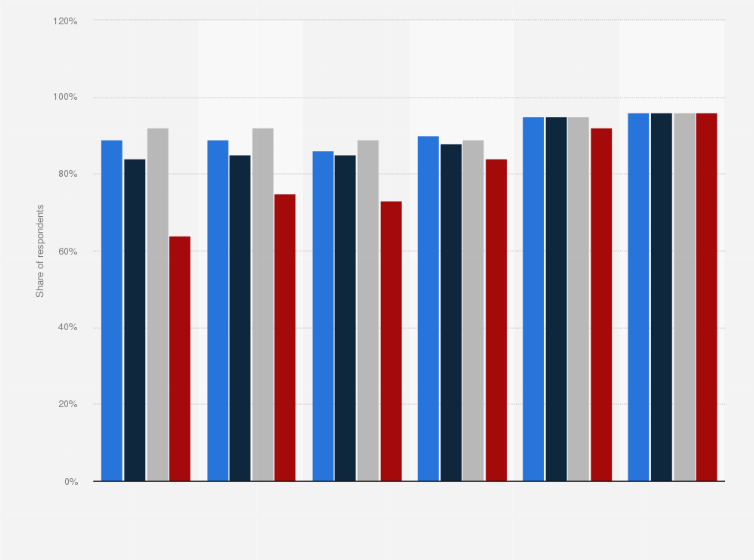
In 2021, 96 percent of respondents from a global survey state using container technology in the proof of concept, development, and test environments. This indicates that organizations move more workloads as they become more comfortable with using containers overall. Container technology refers to a method of packaging an application. Packaged in a container, the application can run with isolated dependencies. This makes it possible to easily move the contained application between different environments.
Adoption rate of container technologies in organizations worldwide from 2016 to 2021, by development stage
Adjust the presentation of the statistic and data points.
Share the statistic on social media channels or embed the statistic in your
website using "Embed Code", where available.
Cite this statistic and select one of the following formats: APA, Chicago, Harvard, MLA & Bluebook.
Print the statistic including description and metadata.
Chart type
Adoption rate of container technologies in organizations worldwide from 2016 to 2021, by development stage
Share this statistic
You have no right to use this feature.
Make sure to contact us if you are interested in scientific citation.
You can upgrade your account to enable this functionality for all statistics.
This feature is not available with your current account.Request access
Majority of respondents come from software/technology organizations (56%). Other industries included are financial services (9%), consulting (6%), telecommunications (5%).
Learn more about how Statista can support your business.
CNCF. (February 1, 2022). Adoption rate of container technologies in organizations worldwide from 2016 to 2021, by development stage [Graph]. In Statista. Retrieved April 24, 2025, from https://www.statista.com/statistics/1104543/worldwide-container-technology-use/
CNCF. "Adoption rate of container technologies in organizations worldwide from 2016 to 2021, by development stage." Chart. February 1, 2022. Statista. Accessed April 24, 2025. https://www.statista.com/statistics/1104543/worldwide-container-technology-use/
CNCF. (2022). Adoption rate of container technologies in organizations worldwide from 2016 to 2021, by development stage. Statista. Statista Inc.. Accessed: April 24, 2025. https://www.statista.com/statistics/1104543/worldwide-container-technology-use/
CNCF. "Adoption Rate of Container Technologies in Organizations Worldwide from 2016 to 2021, by Development Stage." Statista, Statista Inc., 1 Feb 2022, https://www.statista.com/statistics/1104543/worldwide-container-technology-use/
CNCF, Adoption rate of container technologies in organizations worldwide from 2016 to 2021, by development stage Statista, https://www.statista.com/statistics/1104543/worldwide-container-technology-use/ (last visited April 24, 2025)
Adoption rate of container technologies in organizations worldwide from 2016 to 2021, by development stage [Graph], CNCF, February 1, 2022. [Online]. Available: https://www.statista.com/statistics/1104543/worldwide-container-technology-use/
Profit from additional features with an Employee Account
Please create an employee account to be able to mark statistics as favorites.
Then you can access your favorite statistics via the star in the header.
Profit from the additional features of your individual account
Currently, you are using a shared account. To use individual functions (e.g., mark statistics as favourites, set
statistic alerts) please log in with your personal account.
If you are an admin, please authenticate by logging in again.