Motor vehicle sales worldwide by type 2016-2023
Published by
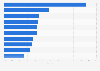
Motor vehicle sales grew by some 11.9 percent worldwide between 2022 and 2023. Passenger vehicles increased by around11.3 percent compared to the previous year when some 58.6 million cars were sold worldwide.
The current state of the market
In 2023, motor vehicle sales reached over 92.7 million units worldwide. China was the largest automobile market worldwide, making up close to 25.8 million of the new car registrations that same year. The United States and Europe ranked second and third, with light vehicle sales reaching approximately 15.5 million units in the U.S. market. The German-based Volkswagen Group and Japanese Toyota Motor were the global leading automakers, with revenues reaching around 348.6 and 311.9 billion U.S. dollars respectively as of May 2024.
The path to recovery
The automotive chip shortage led to around 11.3 million vehicles being cut from worldwide production in 2021, and forecasts estimate that these disruptions in the automotive supply chain will contribute to the removal of another seven million units from production in 2022. However, despite these challenges, the demand for passenger cars increased in 2021 and 2022, as car sales slowly started to increase. This is partly due to consumers' interest in electric vehicles. Autonomous,electrified, and battery electric vehicles are also forecast to gain popularity in the next decades. Electrified vehicles are projected to make up close to a quarter of car sales worldwide by 2025. By 2040, China is forecast to be one of the largest market for autonomous vehicle sales.