Global business tourism spending was increased slightly in 2022 after a significant drop due to the coronavirus (COVID-19) pandemic. After peaking at approximately 1.4 trillion U.S. dollars in 2019, the expenditure made by business travelers worldwide plummeted to the lowest figure reported since 2005. Business travel is a branch of the tourism industry focusing on trips made for work-related purposes. Attending congresses, meetings, and trade fairs, for instance, are among the main activities related to this market.
How did the COVID-19 pandemic hit domestic and international business trips?
After the outbreak of the coronavirus (COVID-19) pandemic in 2020, companies worldwide had to revisit their trip plans, as different restrictions adopted across the world disrupted global travel. According to a study by the Global Business Travel Association (GBTA), the share of companies canceling most or all domestic business trips worldwide reached 38 percent as of October 2021. Meanwhile, almost eight in ten surveyed firms suspended international business travel as of the same month.
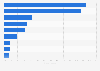
Which company spent the most on booked air volume in the U.S.?
As the pandemic hit the business travel market hard in 2020, it comes as no surprise that the volume of air tickets purchased by companies in the United States experienced a sharp decline due to the health crisis. While Deloitte spent over 583 million U.S. dollars on air travel in 2019, it reported an expenditure of 97 million U.S. dollars in 2020. That year, the company ranked as the second leading air travel spender in the U.S. behind Amazon.
Expenditure of business tourists worldwide from 2001 to 2022
(in billion U.S. dollars)
Characteristic
Expenditure in billion U.S. dollars
-
-
-
-
-
-
-
-
-
-
-
-
-
-
-
-
-
-
-
-
-
-
-
-
-
-
-
-
-
-
-
-
-
-
-
-
-
-
-
-
-
-
-
-
Exclusive Premium Statistic
To access all Premium Statistics, you need a paid Statista Account
Profit from the additional features of your individual account
Currently, you are using a shared account. To use individual functions (e.g., mark statistics as favourites, set
statistic alerts) please log in with your personal account.
If you are an admin, please authenticate by logging in again.
Learn more about how Statista can support your business.
GBTA. (August 1, 2023). Expenditure of business tourists worldwide from 2001 to 2022 (in billion U.S. dollars) [Graph]. In Statista. Retrieved July 03, 2024, from https://www.statista.com/statistics/1093295/business-travel-spending-worldwide/
GBTA. "Expenditure of business tourists worldwide from 2001 to 2022 (in billion U.S. dollars) ." Chart. August 1, 2023. Statista. Accessed July 03, 2024. https://www.statista.com/statistics/1093295/business-travel-spending-worldwide/
GBTA. (2023). Expenditure of business tourists worldwide from 2001 to 2022 (in billion U.S. dollars) . Statista. Statista Inc.. Accessed: July 03, 2024. https://www.statista.com/statistics/1093295/business-travel-spending-worldwide/
GBTA. "Expenditure of Business Tourists Worldwide from 2001 to 2022 (in Billion U.S. Dollars) ." Statista, Statista Inc., 1 Aug 2023, https://www.statista.com/statistics/1093295/business-travel-spending-worldwide/
GBTA, Expenditure of business tourists worldwide from 2001 to 2022 (in billion U.S. dollars) Statista, https://www.statista.com/statistics/1093295/business-travel-spending-worldwide/ (last visited July 03, 2024)
Expenditure of business tourists worldwide from 2001 to 2022 (in billion U.S. dollars) [Graph], GBTA, August 1, 2023. [Online]. Available: https://www.statista.com/statistics/1093295/business-travel-spending-worldwide/