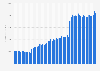
The MTN Group, a South African-based multinational telecommunications company, generates most of its revenue from mobile products and services. In 2023, their outgoing voice revenue amounted to about 3.7 billion U.S. dollars, a significant decrease compared to the previous year. In contrast, revenue from data usage reached some 4.4 billion U.S. dollars that year, marking a significant increase of over 200 million U.S. dollars in revenue for the data segment. The data segment has been on a growth trajectory since 2019 and could overtake the voice segment next year as MTN Group's most revenue-generating segment.
Revenue of MTN Group from 2019 to 2023, by segment
(in million U.S. dollars)
Profit from the additional features of your individual account
Currently, you are using a shared account. To use individual functions (e.g., mark statistics as favourites, set
statistic alerts) please log in with your personal account.
If you are an admin, please authenticate by logging in again.
Learn more about how Statista can support your business.
MTN Group. (September 23, 2024). Revenue of MTN Group from 2019 to 2023, by segment (in million U.S. dollars) [Graph]. In Statista. Retrieved December 21, 2024, from https://www.statista.com/statistics/1074488/mtn-group-revenue-by-segment/
MTN Group. "Revenue of MTN Group from 2019 to 2023, by segment (in million U.S. dollars)." Chart. September 23, 2024. Statista. Accessed December 21, 2024. https://www.statista.com/statistics/1074488/mtn-group-revenue-by-segment/
MTN Group. (2024). Revenue of MTN Group from 2019 to 2023, by segment (in million U.S. dollars). Statista. Statista Inc.. Accessed: December 21, 2024. https://www.statista.com/statistics/1074488/mtn-group-revenue-by-segment/
MTN Group. "Revenue of Mtn Group from 2019 to 2023, by Segment (in Million U.S. Dollars)." Statista, Statista Inc., 23 Sep 2024, https://www.statista.com/statistics/1074488/mtn-group-revenue-by-segment/
MTN Group, Revenue of MTN Group from 2019 to 2023, by segment (in million U.S. dollars) Statista, https://www.statista.com/statistics/1074488/mtn-group-revenue-by-segment/ (last visited December 21, 2024)
Revenue of MTN Group from 2019 to 2023, by segment (in million U.S. dollars) [Graph], MTN Group, September 23, 2024. [Online]. Available: https://www.statista.com/statistics/1074488/mtn-group-revenue-by-segment/