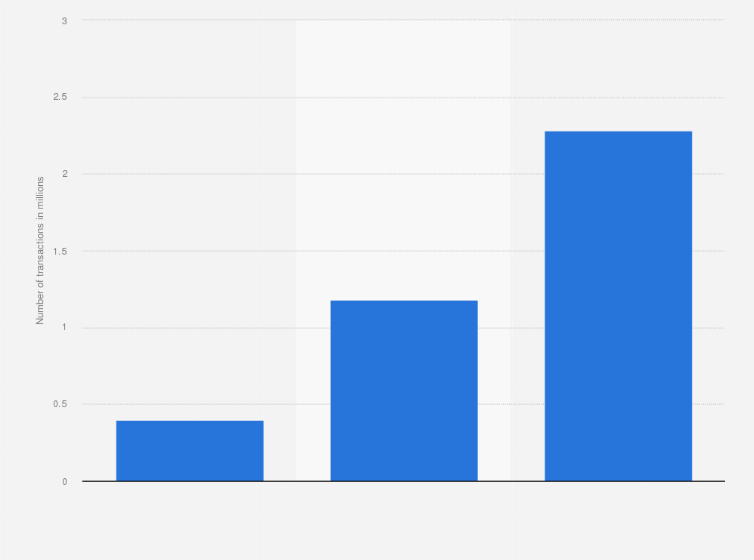
This statistic shows the average daily number of mobile payment transactions made offline in South Korea from 2016 to 2018. In 2018, there were around 2.28 million mobile payment transactions made offline daily on average, up from 0.4 million in 2016.
Average daily number of mobile payment transactions made offline in South Korea from 2016 to 2018
(in millions)
Adjust the presentation of the statistic and data points.
Share the statistic on social media channels or embed the statistic in your
website using "Embed Code", where available.
Cite this statistic and select one of the following formats: APA, Chicago, Harvard, MLA & Bluebook.
Print the statistic including description and metadata.
Chart type
Average daily number of mobile payment transactions made offline in South Korea from 2016 to 2018
Share this statistic
You have no right to use this feature.
Make sure to contact us if you are interested in scientific citation.
You can upgrade your account to enable this functionality for all statistics.
This feature is not available with your current account.Request access
According to the source, mobile payment is a mobile payment or remittance service using the simple authentication method (eg password) after the use of the official certificate has been abolished as of March 2015 in South Korea.
Citation formats
Access all statistics starting from $2,388 USD yearly
*
* For commercial use only
Basic Account
For single users
$0 USD
Always free
Access limited to Free Statistics. Premium Statistics are not included.
Statista has been my savior on several occasions.
The site is easy to maneuver and the data is in a format that can
go right into a report or presentation.
Learn more about how Statista can support your business.
Bank of Korea. (April 3, 2019). Average daily number of mobile payment transactions made offline in South Korea from 2016 to 2018 (in millions) [Graph]. In Statista. Retrieved April 28, 2025, from https://www.statista.com/statistics/1015608/south-korea-offline-m-payment-transactions-daily-number/
Bank of Korea. "Average daily number of mobile payment transactions made offline in South Korea from 2016 to 2018 (in millions)." Chart. April 3, 2019. Statista. Accessed April 28, 2025. https://www.statista.com/statistics/1015608/south-korea-offline-m-payment-transactions-daily-number/
Bank of Korea. (2019). Average daily number of mobile payment transactions made offline in South Korea from 2016 to 2018 (in millions). Statista. Statista Inc.. Accessed: April 28, 2025. https://www.statista.com/statistics/1015608/south-korea-offline-m-payment-transactions-daily-number/
Bank of Korea. "Average Daily Number of Mobile Payment Transactions Made Offline in South Korea from 2016 to 2018 (in Millions)." Statista, Statista Inc., 3 Apr 2019, https://www.statista.com/statistics/1015608/south-korea-offline-m-payment-transactions-daily-number/
Bank of Korea, Average daily number of mobile payment transactions made offline in South Korea from 2016 to 2018 (in millions) Statista, https://www.statista.com/statistics/1015608/south-korea-offline-m-payment-transactions-daily-number/ (last visited April 28, 2025)
Average daily number of mobile payment transactions made offline in South Korea from 2016 to 2018 (in millions) [Graph], Bank of Korea, April 3, 2019. [Online]. Available: https://www.statista.com/statistics/1015608/south-korea-offline-m-payment-transactions-daily-number/
Profit from additional features with an Employee Account
Please create an employee account to be able to mark statistics as favorites.
Then you can access your favorite statistics via the star in the header.
Profit from the additional features of your individual account
Currently, you are using a shared account. To use individual functions (e.g., mark statistics as favourites, set
statistic alerts) please log in with your personal account.
If you are an admin, please authenticate by logging in again.