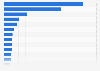
This statistic displays the results of a survey conducted in 2017 on internet users who were streaming with or without short video clips, divided by frequency. 28 percent of respondents streamed without short clips one to four days a week. 36 percent of respondents streamed with short clips daily or almost daily.
Share of individuals who stream online with and without short video clips in Denmark in 2017, by frequency
Loading statistic...
Basic Account
Get to know the platform
You only have access to basic statistics.
Starter Account
The ideal entry-level account for individual users
- Instant access to 1m statistics
- Download in XLS, PDF & PNG format
- Detailed references
$199 USD / Month *
Professional Account
Full access
Business Solutions including all features.
* Prices do not include sales tax.
Other statistics that may interest you Statistics on
About the industry
10
- Premium Statistic Daily reach of the internet in Germany 2017-2023
- Premium Statistic Twitter: usage penetration in the United States 2019-2024
- Premium Statistic U.S. Instagram usage rate 2018-2023
- Basic Statistic Reasons for not using the internet in Sweden 2019
- Basic Statistic Mobile devices to access the internet outside home and workplace in Denmark 2018
- Premium Statistic Number of SK Broadband internet subscribers South Korea 2010-2018
- Premium Statistic Number of LG U+ broadband internet subscribers South Korea 2010-2018
- Premium Statistic Number of broadband internet subscribers South Korea 2018, by provider
- Premium Statistic Number of broadband internet subscribers South Korea 2010-2018
- Premium Statistic Number of KT broadband internet subscribers South Korea 2010-2018
About the region
10
- Premium Statistic Frequency of streaming videos in Denmark 2019-2020
- Premium Statistic Streaming videos at least weekly in Denmark in 2018-2020, by age
- Premium Statistic Time spent of watching TV or streaming videos in Denmark H1 2018
- Premium Statistic Frequency of using Netflix in Denmark H1 2018
- Premium Statistic Frequency of using Netflix in Denmark H1 2018, by age
- Premium Statistic Use of digital devices among children in Denmark 2018
- Premium Statistic News brand trust in Denmark 2023
- Premium Statistic Leading social media and messaging platforms for news in Denmark 2023
- Premium Statistic Consumption of films and series in Denmark Q4 2023, by access
- Premium Statistic Percentage of internet users once a week in selected Nordic countries 2022
Selected statistics
1
Other regions
10
- Basic Statistic Share of the population who never used the internet in Belgium 2008-2023
- Premium Statistic Argentina: share of internet users on selected social media 2020
- Premium Statistic Household internet access in Italy 2019, by connection type
- Premium Statistic Internet distribution by social status in Spain 2020
- Premium Statistic E-commerce usage rate in the European Union 2009-2019, by country
- Premium Statistic Twitter reach Philippines 2014-2019
- Basic Statistic VPN usage for better media content 2018, by region
- Basic Statistic Social media apps used by children in Romania 2018
- Premium Statistic Key figures of Sina Weibo microblog leading user activities in China 2018
- Premium Statistic Share of elderly who use Vipps on their smartphone in Norway 2018, by frequency
Related statistics
10
- Basic Statistic Share of the population that never used the internet Belgium 2008-2023, by gender
- Basic Statistic Share of the population that never used the Internet in Belgium 2008-2020, by region
- Basic Statistic Internet users in Italy 2015-2021, by metropolitan area
- Premium Statistic Italy: internet users 2015-2022, by region
- Premium Statistic Share of internet users in Italy 2015-2022, by geographical area
- Premium Statistic Internet usage among individuals in Italy 2020, by gender
- Basic Statistic Global internet user penetration 2014-2024
- Premium Statistic Share of individuals using the internet daily in Denmark 2023, by age group
- Premium Statistic Level of awareness of key cybercrime terms worldwide in 2019-2022
- Premium Statistic Outcomes for organizations after ransom payments worldwide 2023
Further related statistics
5
Further Content: You might find this interesting as well
Statistics
Slots- og Kulturstyrelsen. (June 20, 2018). Share of individuals who stream online with and without short video clips in Denmark in 2017, by frequency [Graph]. In Statista. Retrieved May 23, 2024, from https://www.statista.com/statistics/1006523/frequency-of-streaming-online-with-without-video-clips-in-denmark/
Slots- og Kulturstyrelsen. "Share of individuals who stream online with and without short video clips in Denmark in 2017, by frequency." Chart. June 20, 2018. Statista. Accessed May 23, 2024. https://www.statista.com/statistics/1006523/frequency-of-streaming-online-with-without-video-clips-in-denmark/
Slots- og Kulturstyrelsen. (2018). Share of individuals who stream online with and without short video clips in Denmark in 2017, by frequency. Statista. Statista Inc.. Accessed: May 23, 2024. https://www.statista.com/statistics/1006523/frequency-of-streaming-online-with-without-video-clips-in-denmark/
Slots- og Kulturstyrelsen. "Share of Individuals Who Stream Online with and without Short Video Clips in Denmark in 2017, by Frequency." Statista, Statista Inc., 20 Jun 2018, https://www.statista.com/statistics/1006523/frequency-of-streaming-online-with-without-video-clips-in-denmark/
Slots- og Kulturstyrelsen, Share of individuals who stream online with and without short video clips in Denmark in 2017, by frequency Statista, https://www.statista.com/statistics/1006523/frequency-of-streaming-online-with-without-video-clips-in-denmark/ (last visited May 23, 2024)
Share of individuals who stream online with and without short video clips in Denmark in 2017, by frequency [Graph], Slots- og Kulturstyrelsen, June 20, 2018. [Online]. Available: https://www.statista.com/statistics/1006523/frequency-of-streaming-online-with-without-video-clips-in-denmark/