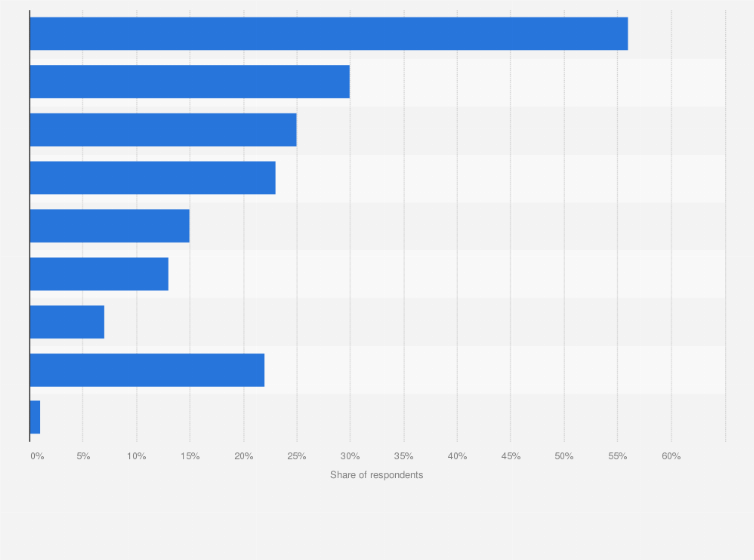
When asked about "Most used devices for video games", most Dutch respondents pick "Smartphone" as an answer. 56 percent did so in our online survey in 2024.
Most used devices for video games in the Netherlands as of December 2024
Adjust the presentation of the statistic and data points.
Share the statistic on social media channels or embed the statistic in your
website using "Embed Code", where available.
Cite this statistic and select one of the following formats: APA, Chicago, Harvard, MLA & Bluebook.
Print the statistic including description and metadata.
Chart type
Most used devices for video games in the Netherlands as of December 2024
Share this statistic
You have no right to use this feature.
Make sure to contact us if you are interested in scientific citation.
You can upgrade your account to enable this functionality for all statistics.
This feature is not available with your current account.Request access
Do you have any questions about our business solutions?
We provide you with detailed information about our Professional Account.
Use Statista now:
unlimited access to all content
Learn more about how Statista can support your business.
Statista. (January 31, 2025). Most used devices for video games in the Netherlands as of December 2024 [Graph]. In Statista. Retrieved April 29, 2025, from https://www.statista.com/forecasts/825859/most-used-devices-for-video-games-in-the-netherlands
Statista. "Most used devices for video games in the Netherlands as of December 2024." Chart. January 31, 2025. Statista. Accessed April 29, 2025. https://www.statista.com/forecasts/825859/most-used-devices-for-video-games-in-the-netherlands
Statista. (2025). Most used devices for video games in the Netherlands as of December 2024. Statista. Statista Inc.. Accessed: April 29, 2025. https://www.statista.com/forecasts/825859/most-used-devices-for-video-games-in-the-netherlands
Statista. "Most Used Devices for Video Games in The Netherlands as of December 2024." Statista, Statista Inc., 31 Jan 2025, https://www.statista.com/forecasts/825859/most-used-devices-for-video-games-in-the-netherlands
Statista, Most used devices for video games in the Netherlands as of December 2024 Statista, https://www.statista.com/forecasts/825859/most-used-devices-for-video-games-in-the-netherlands (last visited April 29, 2025)
Most used devices for video games in the Netherlands as of December 2024 [Graph], Statista, January 31, 2025. [Online]. Available: https://www.statista.com/forecasts/825859/most-used-devices-for-video-games-in-the-netherlands
Profit from additional features with an Employee Account
Please create an employee account to be able to mark statistics as favorites.
Then you can access your favorite statistics via the star in the header.
Profit from the additional features of your individual account
Currently, you are using a shared account. To use individual functions (e.g., mark statistics as favourites, set
statistic alerts) please log in with your personal account.
If you are an admin, please authenticate by logging in again.