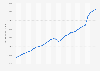
This statistic shows the annual sales of department stores in the United States from 2008 to 2014, with a forecast until 2020. In 2016, the sales of department stores in the U.S. ranged at approximately 58.93 billion U.S. dollars.
Sales of department stores (NAICS 452111) in the United States from 2008 to 2020
(in million U.S. dollars)
Methodology and further information: Historic data were retrieved from the United States Census Bureau up until 2013. All forecasts rely on sophisticated statistical modelling conducted by Statista Research & Analysis. Forecast methods include trend analysis and linear regressions under consideration of relevant market drivers.
Sales include merchandise sold by establishments primarily engaged in retail trade. The sales are net, after deductions, of refunds and allowances for merchandise returned by customers.
Figures exclude discount department stores.
More information on market forecasts on Statista can be found here.
Profit from the additional features of your individual account
Currently, you are using a shared account. To use individual functions (e.g., mark statistics as favourites, set
statistic alerts) please log in with your personal account.
If you are an admin, please authenticate by logging in again.
Access all statistics starting from $2,388 USD yearly
*
Learn more about how Statista can support your business.
Statista. (February 15, 2017). Sales of department stores (NAICS 452111) in the United States from 2008 to 2020 (in million U.S. dollars) [Graph]. In Statista. Retrieved November 22, 2024, from https://www.statista.com/forecasts/311123/us-department-store-sales-forecast-naics-452111
Statista. "Sales of department stores (NAICS 452111) in the United States from 2008 to 2020 (in million U.S. dollars)." Chart. February 15, 2017. Statista. Accessed November 22, 2024. https://www.statista.com/forecasts/311123/us-department-store-sales-forecast-naics-452111
Statista. (2017). Sales of department stores (NAICS 452111) in the United States from 2008 to 2020 (in million U.S. dollars). Statista. Statista Inc.. Accessed: November 22, 2024. https://www.statista.com/forecasts/311123/us-department-store-sales-forecast-naics-452111
Statista. "Sales of Department Stores (Naics 452111) in The United States from 2008 to 2020 (in Million U.S. Dollars)." Statista, Statista Inc., 15 Feb 2017, https://www.statista.com/forecasts/311123/us-department-store-sales-forecast-naics-452111
Statista, Sales of department stores (NAICS 452111) in the United States from 2008 to 2020 (in million U.S. dollars) Statista, https://www.statista.com/forecasts/311123/us-department-store-sales-forecast-naics-452111 (last visited November 22, 2024)
Sales of department stores (NAICS 452111) in the United States from 2008 to 2020 (in million U.S. dollars) [Graph], Statista, February 15, 2017. [Online]. Available: https://www.statista.com/forecasts/311123/us-department-store-sales-forecast-naics-452111