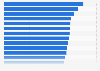
How has the use of social media changed in the United States over the past years? There is only a slight decrease from 2022 Q4 to the current value. This is the low point of a downward trend since 2019.
Overall, average screentime is increasing worldwide. While many consumers spend their time online, the type of social media they use shifts over the years. To continue your research of social media usage you can also have a look at the most used social media platforms in the U.S., which compares social network users with the common types of social media and social networks. The survey was conducted online among 4091 to 60267 respondents per quarter in the United States, between 2019 and 2023. Statista Consumer Insights offer you all results of our exclusive Statista surveys, based on more than 2,000,000 interviews.
Share of U.S. consumers regularly using social networks 2019-2023 as of June 2024, by quarter
During the survey, the question "What kinds of social media do you use regularly?" has been answered with "Social networks (e.g., Facebook)".
Each update contains the interviews of the last 12 months. If you are looking for further details you can find more information in the methodology for the Statista Consumer Insights.
Profit from the additional features of your individual account
Currently, you are using a shared account. To use individual functions (e.g., mark statistics as favourites, set
statistic alerts) please log in with your personal account.
If you are an admin, please authenticate by logging in again.
Access all statistics starting from $2,388 USD yearly
*
Learn more about how Statista can support your business.
Statista. (June 18, 2024). Share of U.S. consumers regularly using social networks 2019-2023 as of June 2024, by quarter [Graph]. In Statista. Retrieved January 09, 2025, from https://www.statista.com/forecasts/1466887/share-of-us-consumers-regularly-using-social-networks
Statista. "Share of U.S. consumers regularly using social networks 2019-2023 as of June 2024, by quarter." Chart. June 18, 2024. Statista. Accessed January 09, 2025. https://www.statista.com/forecasts/1466887/share-of-us-consumers-regularly-using-social-networks
Statista. (2024). Share of U.S. consumers regularly using social networks 2019-2023 as of June 2024, by quarter. Statista. Statista Inc.. Accessed: January 09, 2025. https://www.statista.com/forecasts/1466887/share-of-us-consumers-regularly-using-social-networks
Statista. "Share of U.S. Consumers Regularly Using Social Networks 2019-2023 as of June 2024, by Quarter." Statista, Statista Inc., 18 Jun 2024, https://www.statista.com/forecasts/1466887/share-of-us-consumers-regularly-using-social-networks
Statista, Share of U.S. consumers regularly using social networks 2019-2023 as of June 2024, by quarter Statista, https://www.statista.com/forecasts/1466887/share-of-us-consumers-regularly-using-social-networks (last visited January 09, 2025)
Share of U.S. consumers regularly using social networks 2019-2023 as of June 2024, by quarter [Graph], Statista, June 18, 2024. [Online]. Available: https://www.statista.com/forecasts/1466887/share-of-us-consumers-regularly-using-social-networks