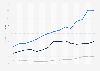
Significant fluctuations are estimated for all segments over the forecast period for the average volume per capita. Nevertheless, the average volume per capita is expected to be clearly the highest in the segment Boots throughout the entire forecast period. For example, this segment reaches a maximum value of 14.96 U.S. dollars, which is significantly higher than the average of other highest values, which is amounting to 4.73 U.S. dollars.
Adjust the presentation of the statistic and data points.
Share the statistic on social media channels or embed the statistic in your
website using "Embed Code", where available.
Cite this statistic and select one of the following formats: APA, Chicago, Harvard, MLA & Bluebook.
Print the statistic including description and metadata.
Chart type
Per capita sales volume in the Footwear market for different segments Hong Kong from 2019 to 2029
Share this statistic
You have no right to use this feature.
Make sure to contact us if you are interested in scientific citation.
You can upgrade your account to enable this functionality for all statistics.
This feature is not available with your current account.Request access
Data provided by Statista Market Insights are estimates.
Definition:
The Footwear market comprises all kinds of shoes that are designed and intended for a variety of activities. This market includes athletic, casual, formal, and other town footwear but excludes work and safety shoes. Depending on their purpose and function, these shoes are made from leather, textile, plastic, rubber, and/or wood materials. The market covers women’s, men’s, and children’s footwear. Just like the Apparel market, the Footwear market is currently being shaped by a tremendous change in customer purchase habits. The upswing in e-commerce store concepts is putting significant pressure on stationary retail stores.
Structure:
The market is divided into Sneakers, Running, Gym & Training, Boots, Business & Formal, Sandals. Sneakers are defined as everyday footwear with an athletic appearance.Running shoes are specifically designed to provide support, cushioning, and stability for running activities. Gym & Training footwear includes shoes designed for various indoor and outdoor training activities, offering versatile support and flexibility for weightlifting, cardio workouts, CrossFit, and other fitness routines. Boots encompass a wide range of styles, including ankle boots, knee-high boots, and hiking boots, designed for durability and protection across various terrains and weather conditions. Business & Formal footwear includes shoes designed for professional and formal occasions, featuring polished leather shoes, classic oxfords, loafers, and dress shoes that complement business attire and evening wear. Sandals are open-toe footwear providing breathability and comfort in warm weather, including casual flip-flops, elegant strappy sandals, and supportive walking sandals suitable for everyday wear and special occasions.
Additional Information:
The market comprises revenue and average revenue per capita, volume and average volume per capita, price per unit (per pair), luxury revenue share, and sales channels. The sales channel Online refers to the purchase of physical goods in online retail. In other words, the purchase is concluded via the internet, be it on a desktop PC, tablet, or smartphone. The distribution channel Offline covers all purchases in stationary stores, by telesales, or via mail order (e.g., print catalogs).
Key players in the market include companies that have the biggest share in the Footwear market such as Nike, Adidas, New Balance, Skechers, and Puma.
For more information on the displayed data, use the info button directly next to the boxes.
Statista has been my savior on several occasions.
The site is easy to maneuver and the data is in a format that can
go right into a report or presentation.
Do you have any questions about our business solutions?
We provide you with detailed information about our Professional Account.
Use Statista now:
unlimited access to all content
Learn more about how Statista can support your business.
Statista Market Insights. (November 28, 2024). Per capita sales volume in the Footwear market for different segments Hong Kong from 2019 to 2029 [Graph]. In Statista. Retrieved January 13, 2025, from https://www.statista.com/forecasts/1441795/per-capita-sales-volume-footwear-market-for-different-segments-hong-kong
Statista Market Insights. "Per capita sales volume in the Footwear market for different segments Hong Kong from 2019 to 2029." Chart. November 28, 2024. Statista. Accessed January 13, 2025. https://www.statista.com/forecasts/1441795/per-capita-sales-volume-footwear-market-for-different-segments-hong-kong
Statista Market Insights. (2024). Per capita sales volume in the Footwear market for different segments Hong Kong from 2019 to 2029. Statista. Statista Inc.. Accessed: January 13, 2025. https://www.statista.com/forecasts/1441795/per-capita-sales-volume-footwear-market-for-different-segments-hong-kong
Statista Market Insights. "Per Capita Sales Volume in The Footwear Market for Different Segments Hong Kong from 2019 to 2029." Statista, Statista Inc., 28 Nov 2024, https://www.statista.com/forecasts/1441795/per-capita-sales-volume-footwear-market-for-different-segments-hong-kong
Statista Market Insights, Per capita sales volume in the Footwear market for different segments Hong Kong from 2019 to 2029 Statista, https://www.statista.com/forecasts/1441795/per-capita-sales-volume-footwear-market-for-different-segments-hong-kong (last visited January 13, 2025)
Per capita sales volume in the Footwear market for different segments Hong Kong from 2019 to 2029 [Graph], Statista Market Insights, November 28, 2024. [Online]. Available: https://www.statista.com/forecasts/1441795/per-capita-sales-volume-footwear-market-for-different-segments-hong-kong
Profit from additional features with an Employee Account
Please create an employee account to be able to mark statistics as favorites.
Then you can access your favorite statistics via the star in the header.
Profit from the additional features of your individual account
Currently, you are using a shared account. To use individual functions (e.g., mark statistics as favourites, set
statistic alerts) please log in with your personal account.
If you are an admin, please authenticate by logging in again.