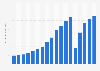
The average revenue per user (ARPU) of the travel & tourism market in Finland was forecast to continuously increase between 2024 and 2029 by in total 61.2 U.S. dollars (+6.12 percent). After the fifth consecutive increasing year, the arpu is estimated to reach 1,061.07 U.S. dollars and therefore a new peak in 2029.
Data provided by Statista Market Insights are estimates.
Definition:
The Travel & Tourism market encompasses a diverse range of accommodation services catering to the needs and preferences of travelers. This dynamic market includes package holidays, hotel accommodations, private vacation rentals, camping experiences, and cruises.
Structure:
The market consists of five further markets.
The Cruises market covers multi-day vacation trips on a cruise ship. The Cruises market encompasses exclusively passenger ticket revenues.
The Vacation Rentals market comprises of private accommodation bookings which includes private holiday homes and houses as well as short-term rental of private rooms or flats.
The Hotels market includes stays in hotels and professionally run guest houses.
The Package Holidays market comprises of travel deals that normally contain travel and accommodation sold for one price, although optional further provisions can be included such as catering and tourist services.
The Camping market includes bookings at camping sites for pitches using tents, campervans, or trailers. These can be associated with big chains or privately managed campsites.
Additional Information:
The main performance indicators of the Travel & Tourism market are revenues, average revenue per user (ARPU), users and user penetration rates. Additionally, online and offline sales channel shares display the distribution of online and offline bookings. The ARPU refers to the average revenue one user generates per year while the revenue represents the total booking volume. Revenues are generated through both online and offline sales channels and include exclusively B2C revenues and users for the above-mentioned markets. Users represent the aggregated number of guests. Each user is only counted once per year. Additional definitions for each market can be found within the respective market pages.
The booking volume includes all booked travels made by users from the selected region, independent of the departure and arrival. The scope includes domestic and outbound travel.
Prominent players in this sector include online travel agencies (OTAs) like Expedia and Opodo, as well as tour operators such as TUI. Specialized platforms like Hotels.com, Booking.com, and Airbnb facilitate the online booking of hotels and private accommodations, contributing significantly to the market's vibrancy.
For further information on the data displayed, refer to the info button right next to each box.
Profit from the additional features of your individual account
Currently, you are using a shared account. To use individual functions (e.g., mark statistics as favourites, set
statistic alerts) please log in with your personal account.
If you are an admin, please authenticate by logging in again.
Learn more about how Statista can support your business.
Statista Market Insights. (September 16, 2024). Average revenue per unit (ARPU) in the travel & tourism market Finland from 2019 to 2029 [Graph]. In Statista. Retrieved December 24, 2024, from https://www.statista.com/forecasts/1437107/average-revenue-per-unit-arpu-travel-tourism-travel-tourism-market-finland
Statista Market Insights. "Average revenue per unit (ARPU) in the travel & tourism market Finland from 2019 to 2029." Chart. September 16, 2024. Statista. Accessed December 24, 2024. https://www.statista.com/forecasts/1437107/average-revenue-per-unit-arpu-travel-tourism-travel-tourism-market-finland
Statista Market Insights. (2024). Average revenue per unit (ARPU) in the travel & tourism market Finland from 2019 to 2029. Statista. Statista Inc.. Accessed: December 24, 2024. https://www.statista.com/forecasts/1437107/average-revenue-per-unit-arpu-travel-tourism-travel-tourism-market-finland
Statista Market Insights. "Average Revenue per Unit (Arpu) in The Travel & Tourism Market Finland from 2019 to 2029." Statista, Statista Inc., 16 Sep 2024, https://www.statista.com/forecasts/1437107/average-revenue-per-unit-arpu-travel-tourism-travel-tourism-market-finland
Statista Market Insights, Average revenue per unit (ARPU) in the travel & tourism market Finland from 2019 to 2029 Statista, https://www.statista.com/forecasts/1437107/average-revenue-per-unit-arpu-travel-tourism-travel-tourism-market-finland (last visited December 24, 2024)
Average revenue per unit (ARPU) in the travel & tourism market Finland from 2019 to 2029 [Graph], Statista Market Insights, September 16, 2024. [Online]. Available: https://www.statista.com/forecasts/1437107/average-revenue-per-unit-arpu-travel-tourism-travel-tourism-market-finland